WIRC Filter Transmission Profiles
Note: This
page is a recreation of the
original page from the University of Virginia, which is now defunct.
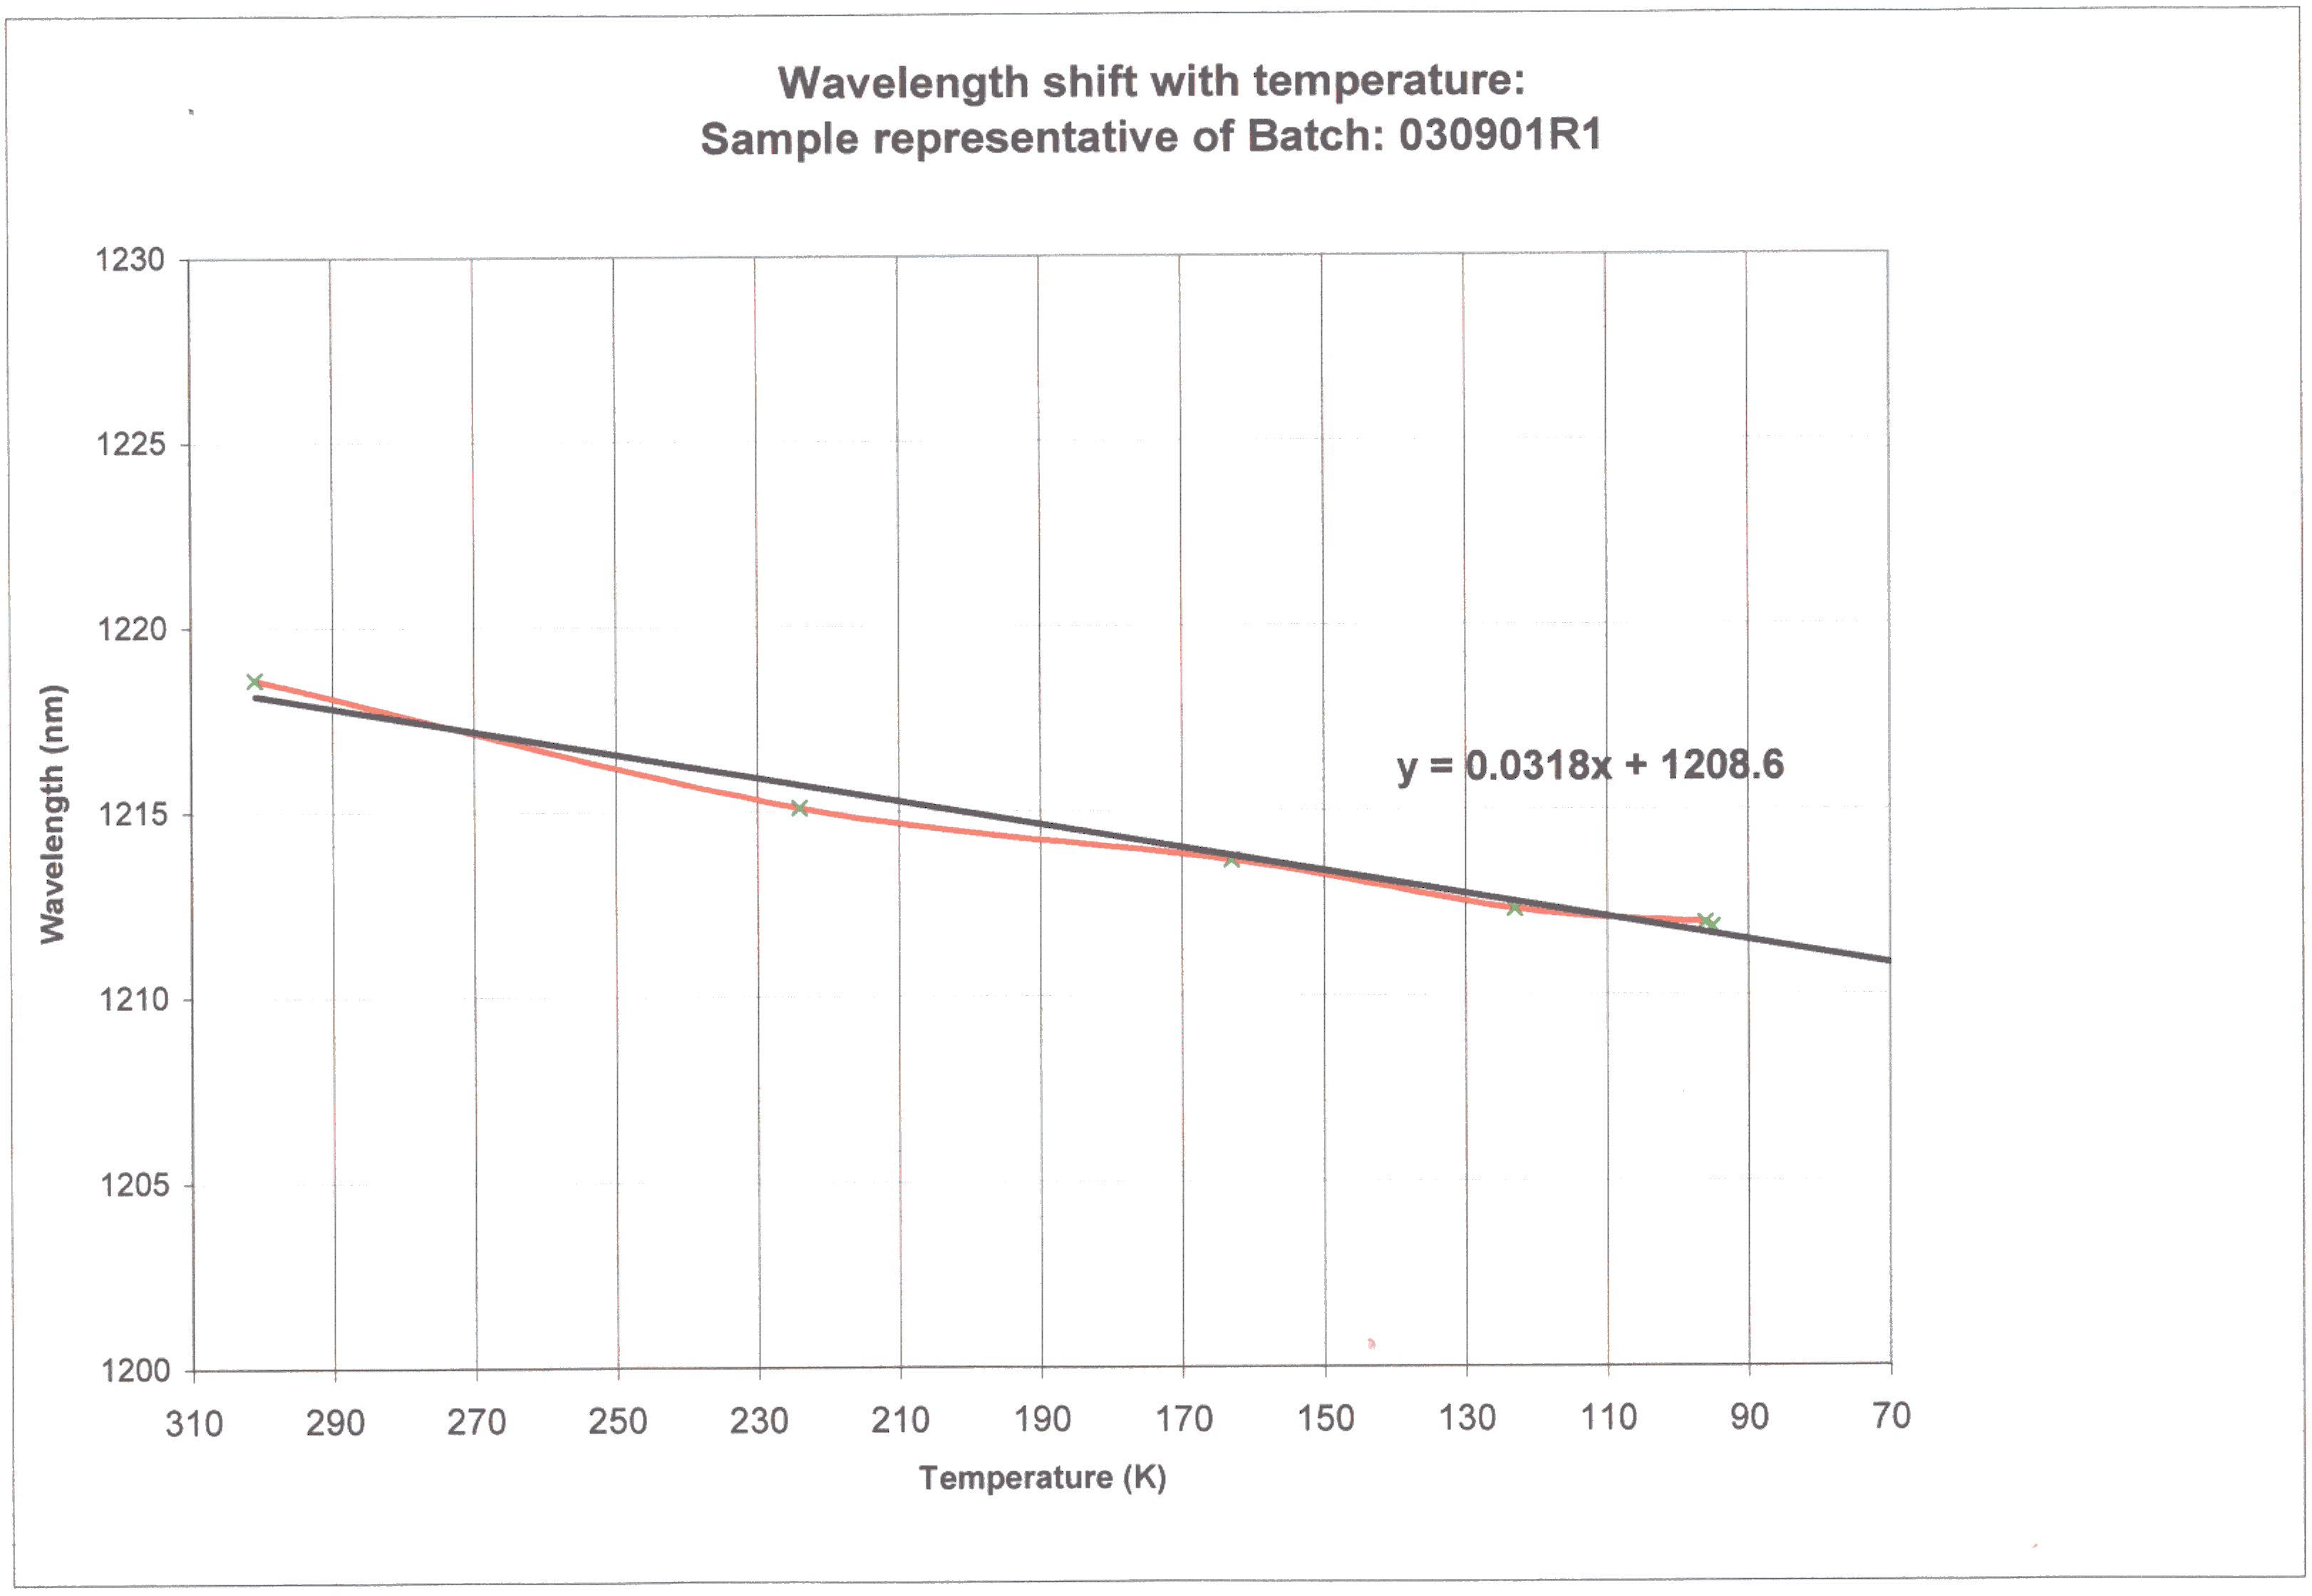
Filters available for use in WIRC are listed below. The filters are used at approximately 77K and 7 degrees angle of incidence (AOI). Most of the manufacturer's provided transmission profiles are for 300K and 0 degrees AOI. Both the temperature and tilt cause a shift of the filter transmission profile blueward. Corrections for these effects have been applied to the manufacturer's supplied data where possible.
Broadband Filters
| Filter | Scanned Data | Original Data | Tilt Corrected Data | Temperature Shift (298 to 77K) | Manufacturer | Note |
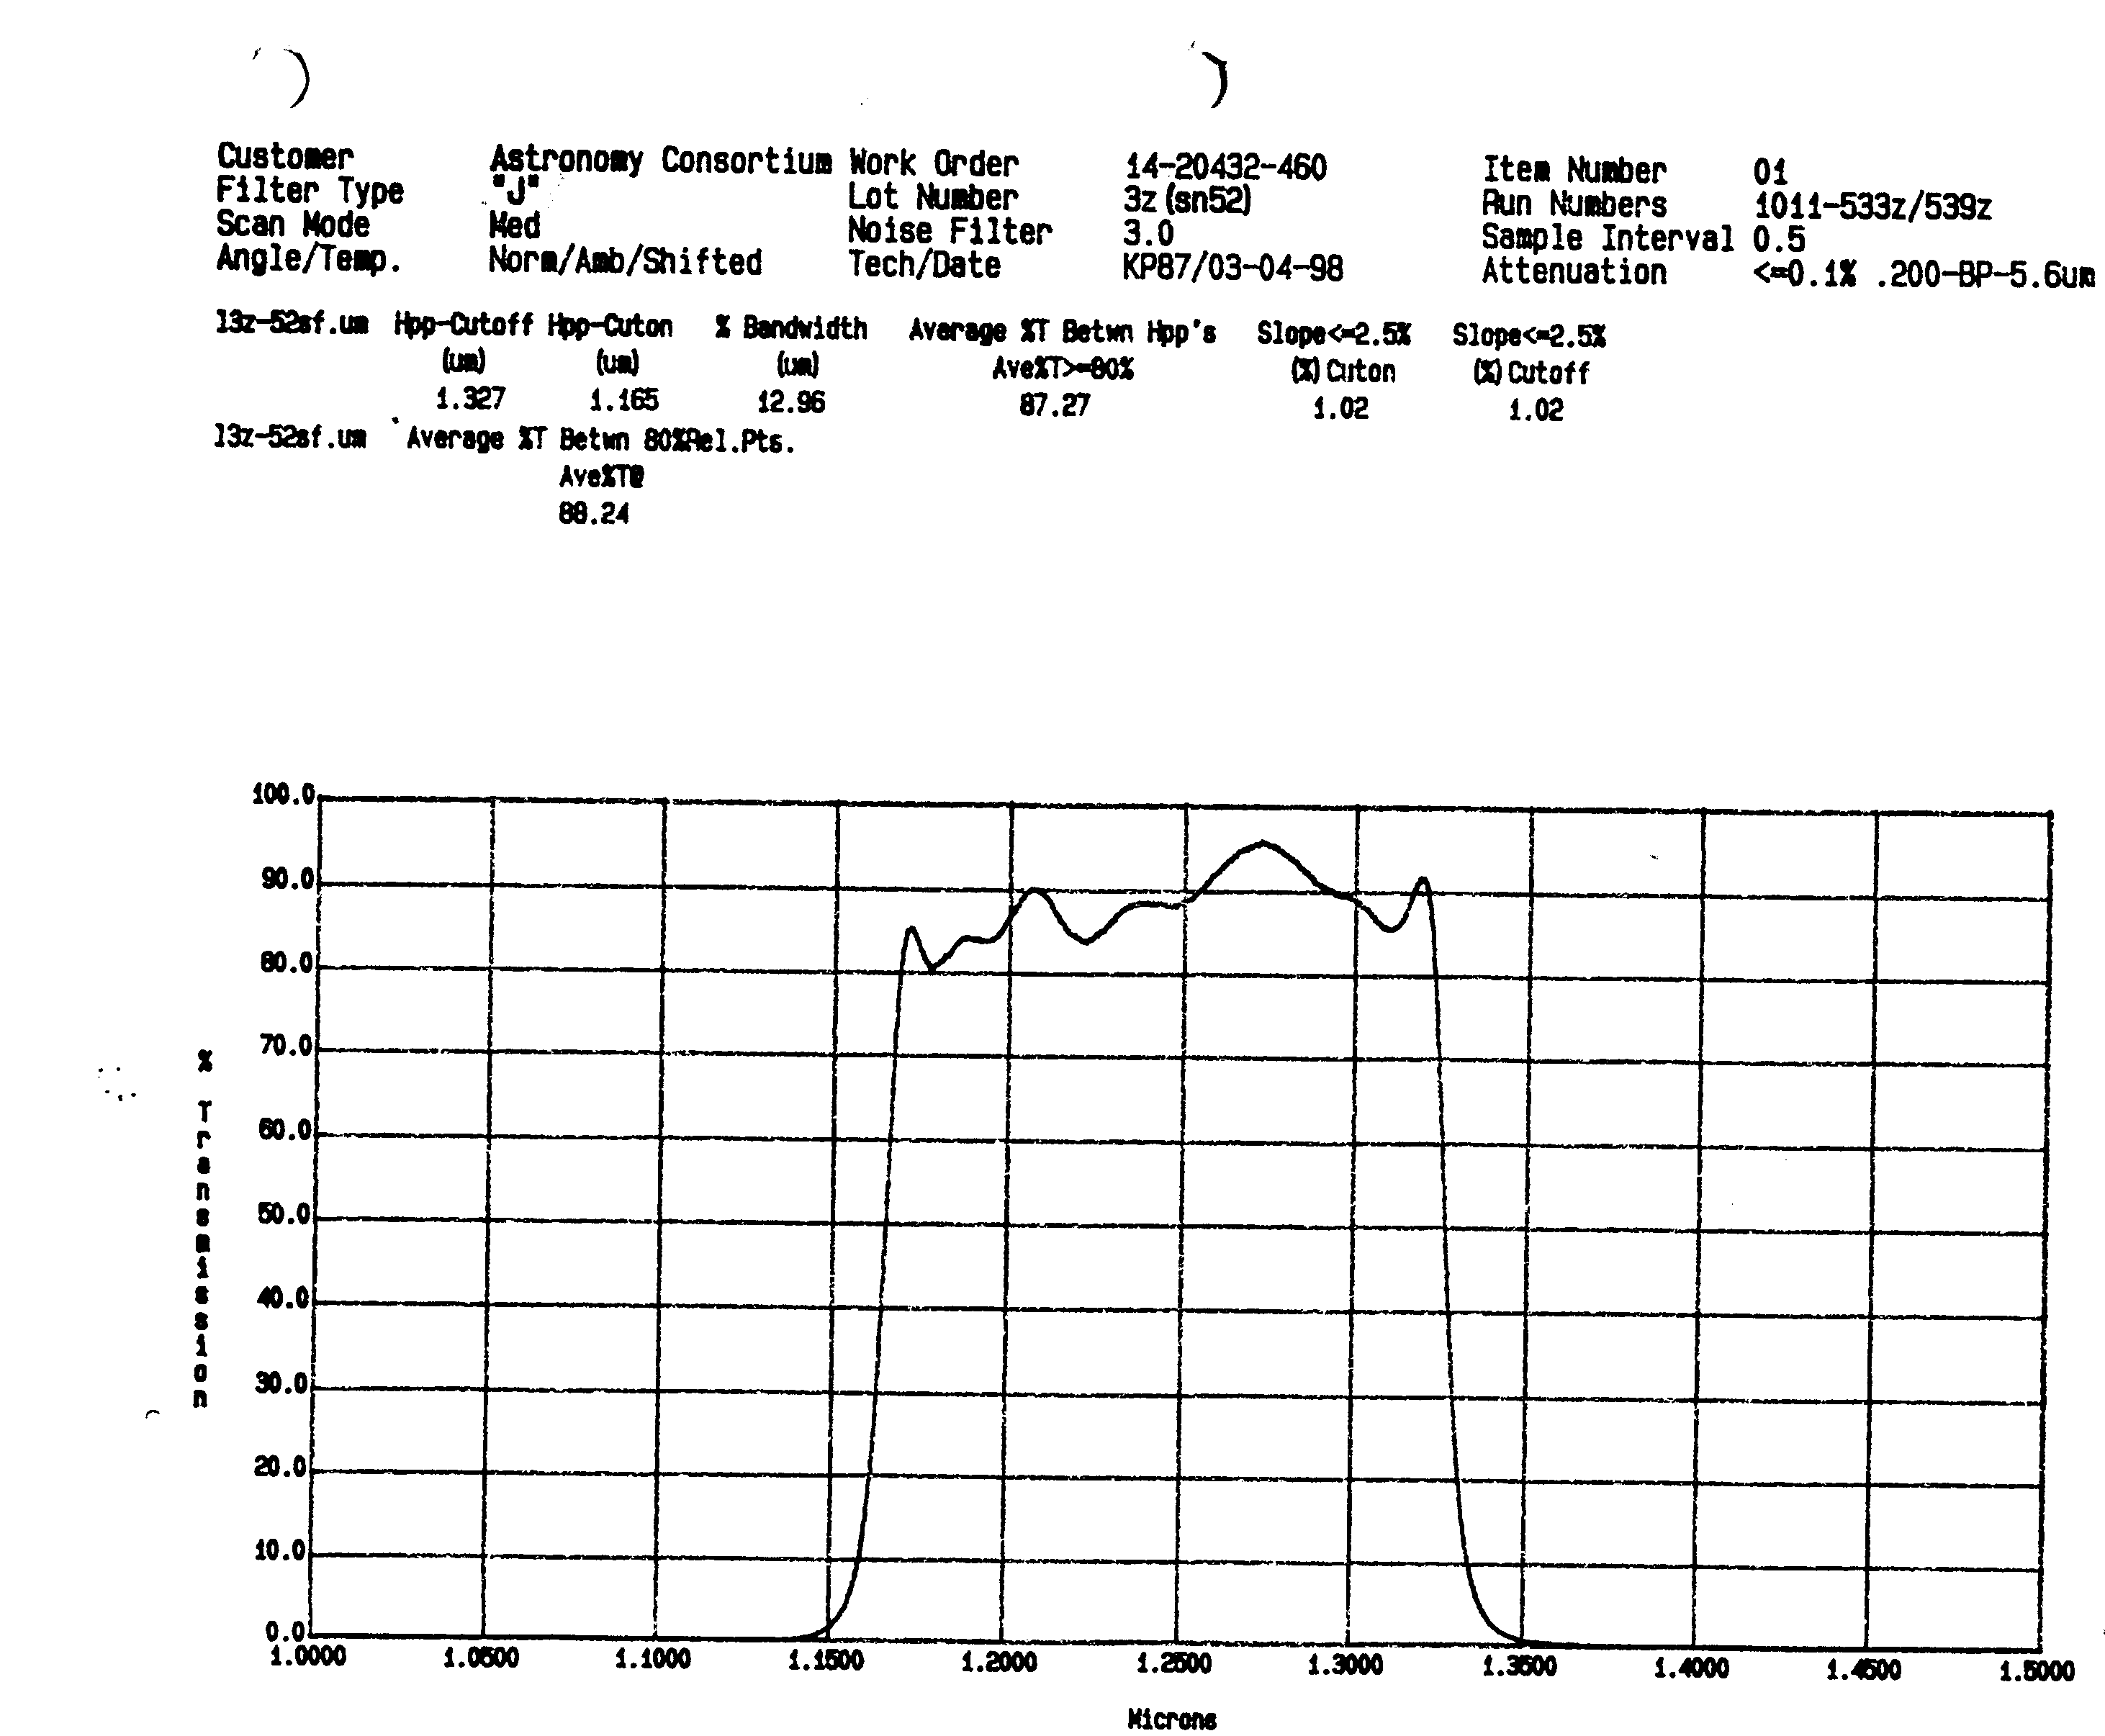
| J | J Graph | OCLI | 1 | |||
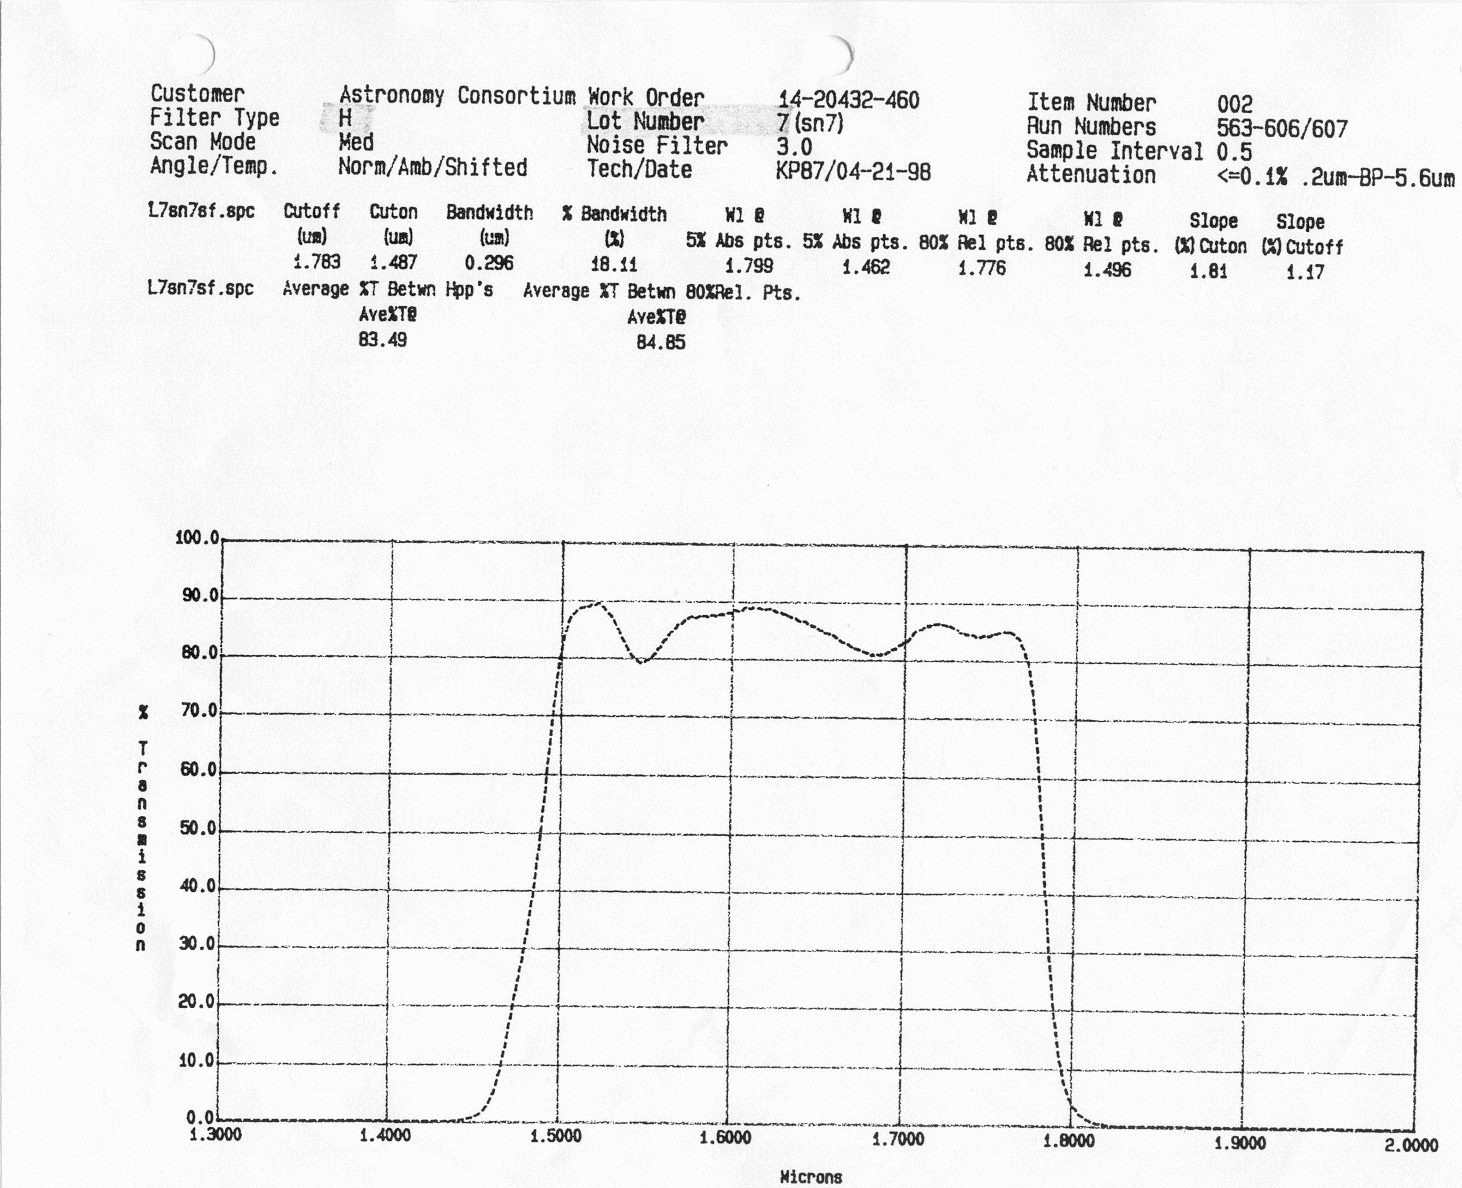
| K | H Graph | OCLI | 1 | |||
| Ks |
Ks Graph K Blocking |
Ks Original |
Ks Tilt |
cut-on: -0.6 nm cut-off: - 0.2 nm |
Barr |
2 |
Narrowband Filters
| Filter | Scanned Zoomed Profile | Original Data (3) | Temperature & Tilt Corrected Data (4,5) | Manufacturer |
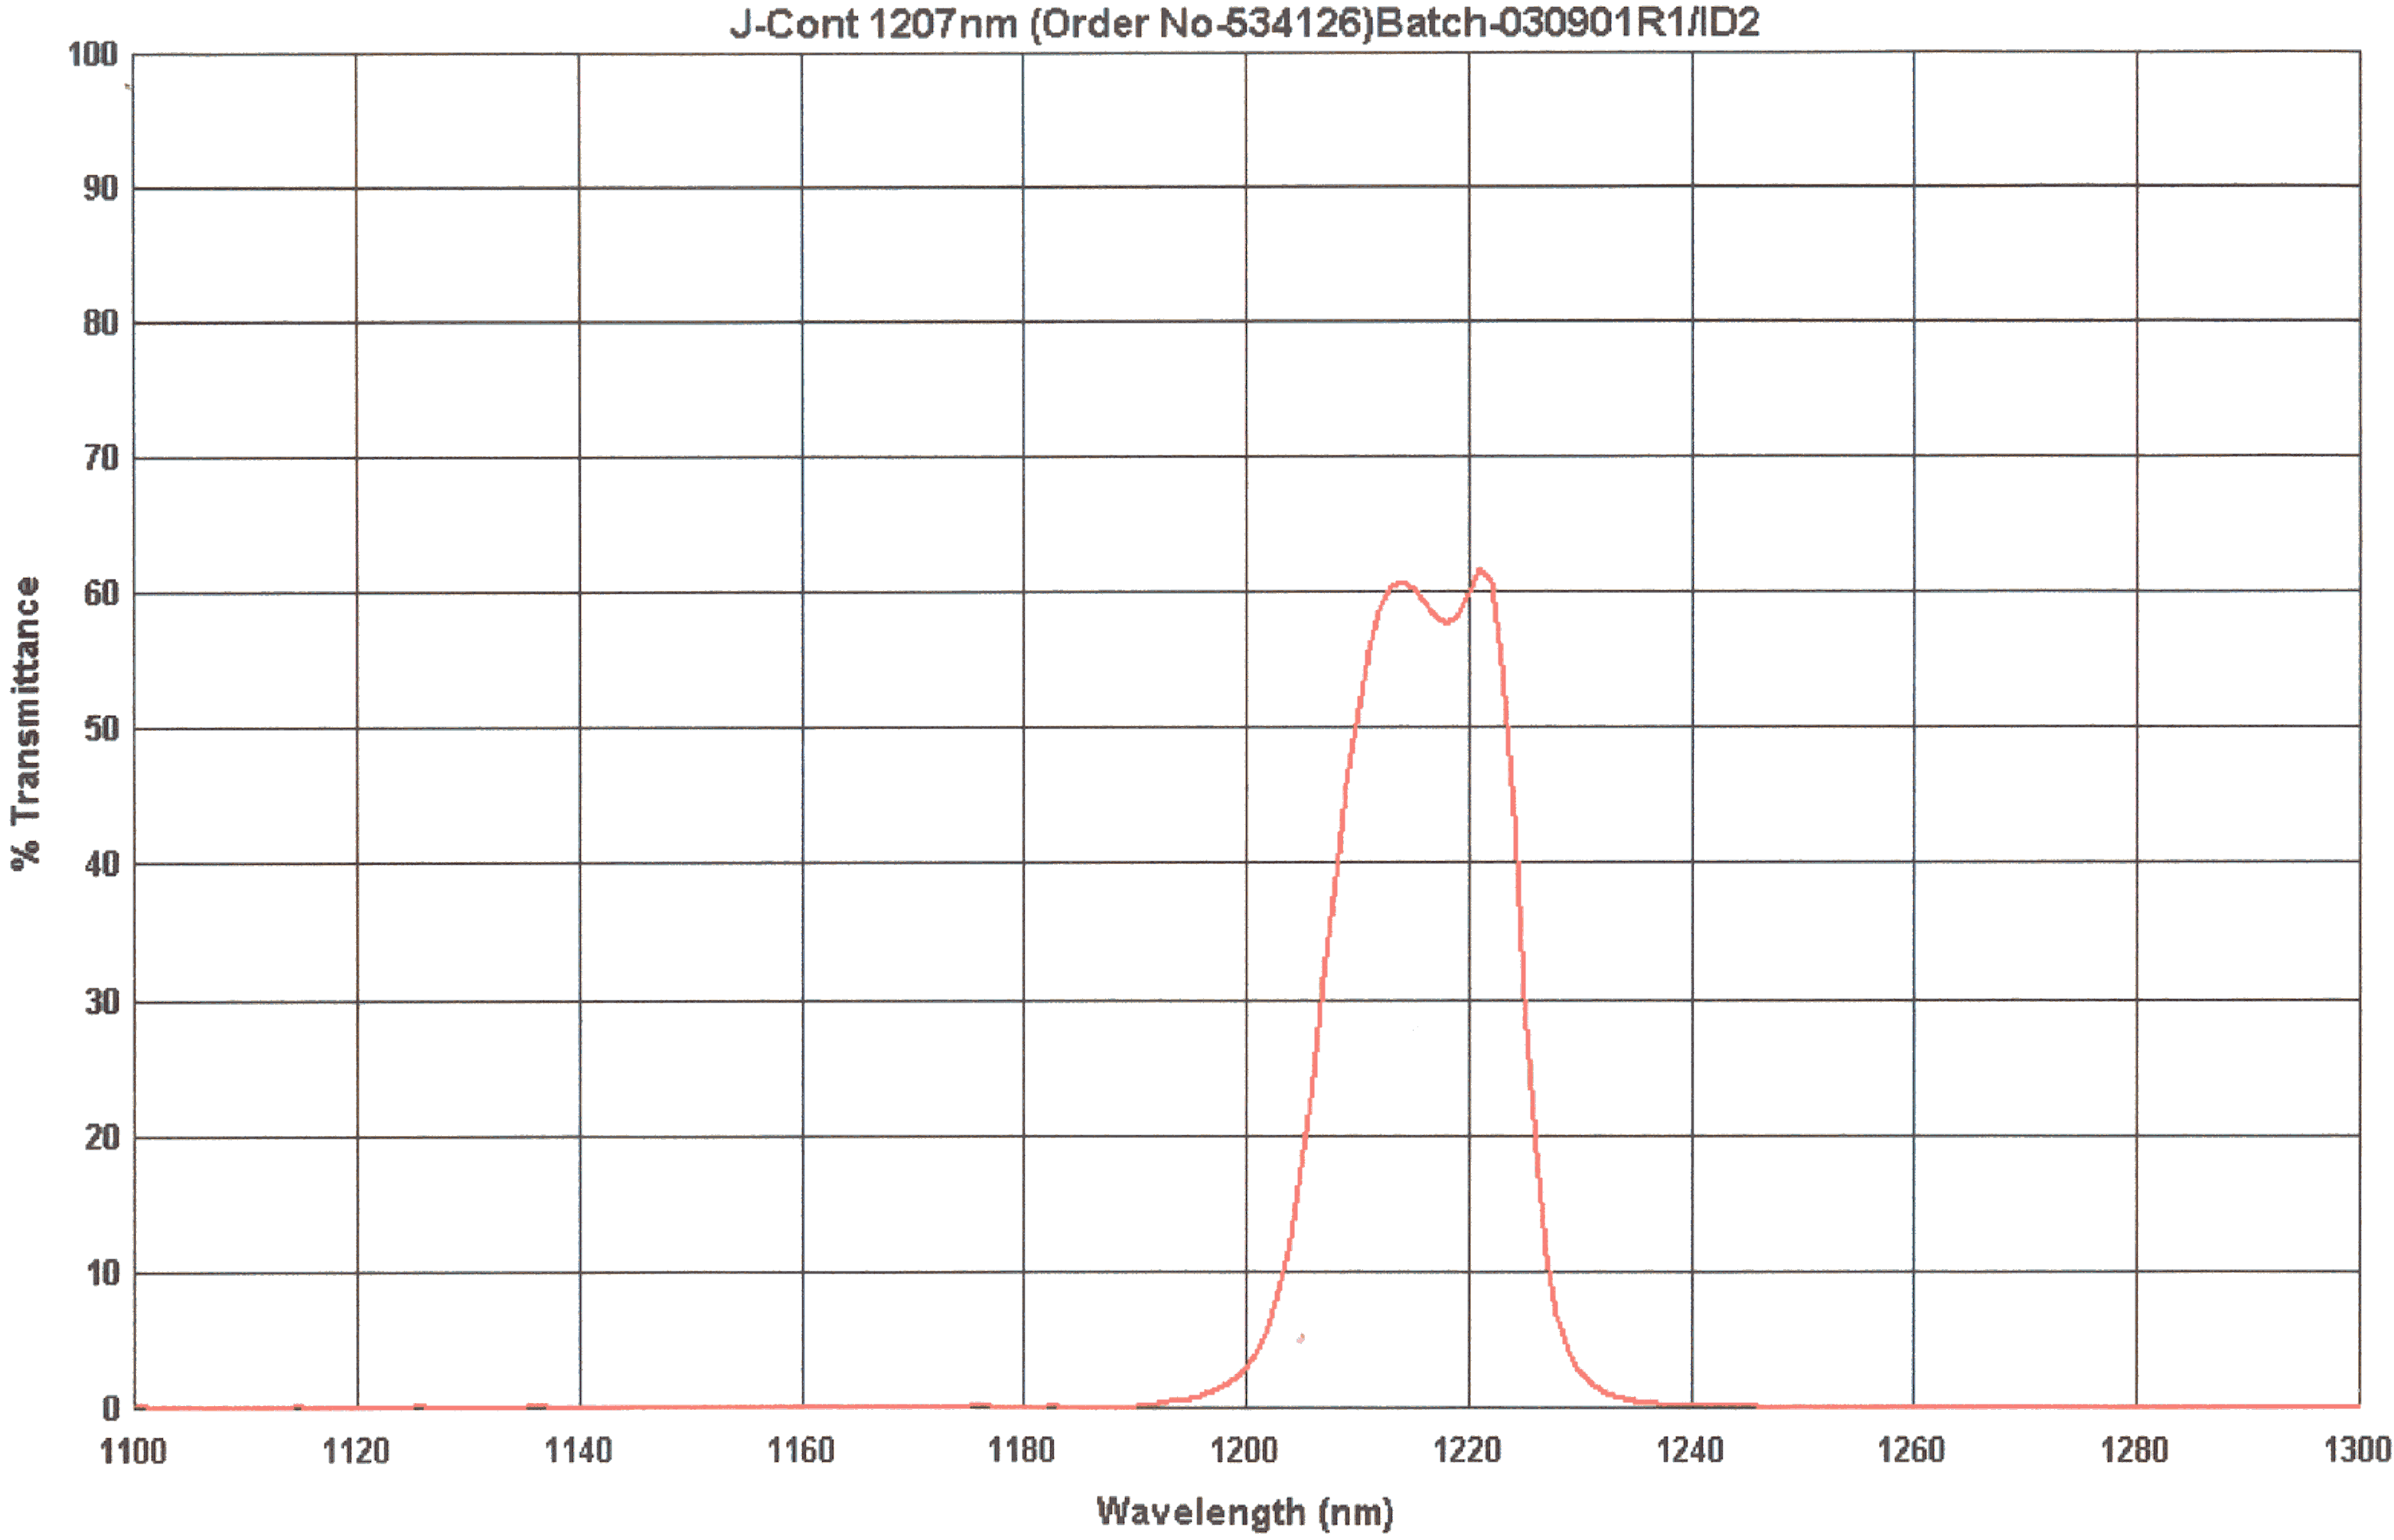
| J-Cont | J-Cont Zoomed Graph | J-Cont Original | J -Cont Temp & Tilt | NDC |
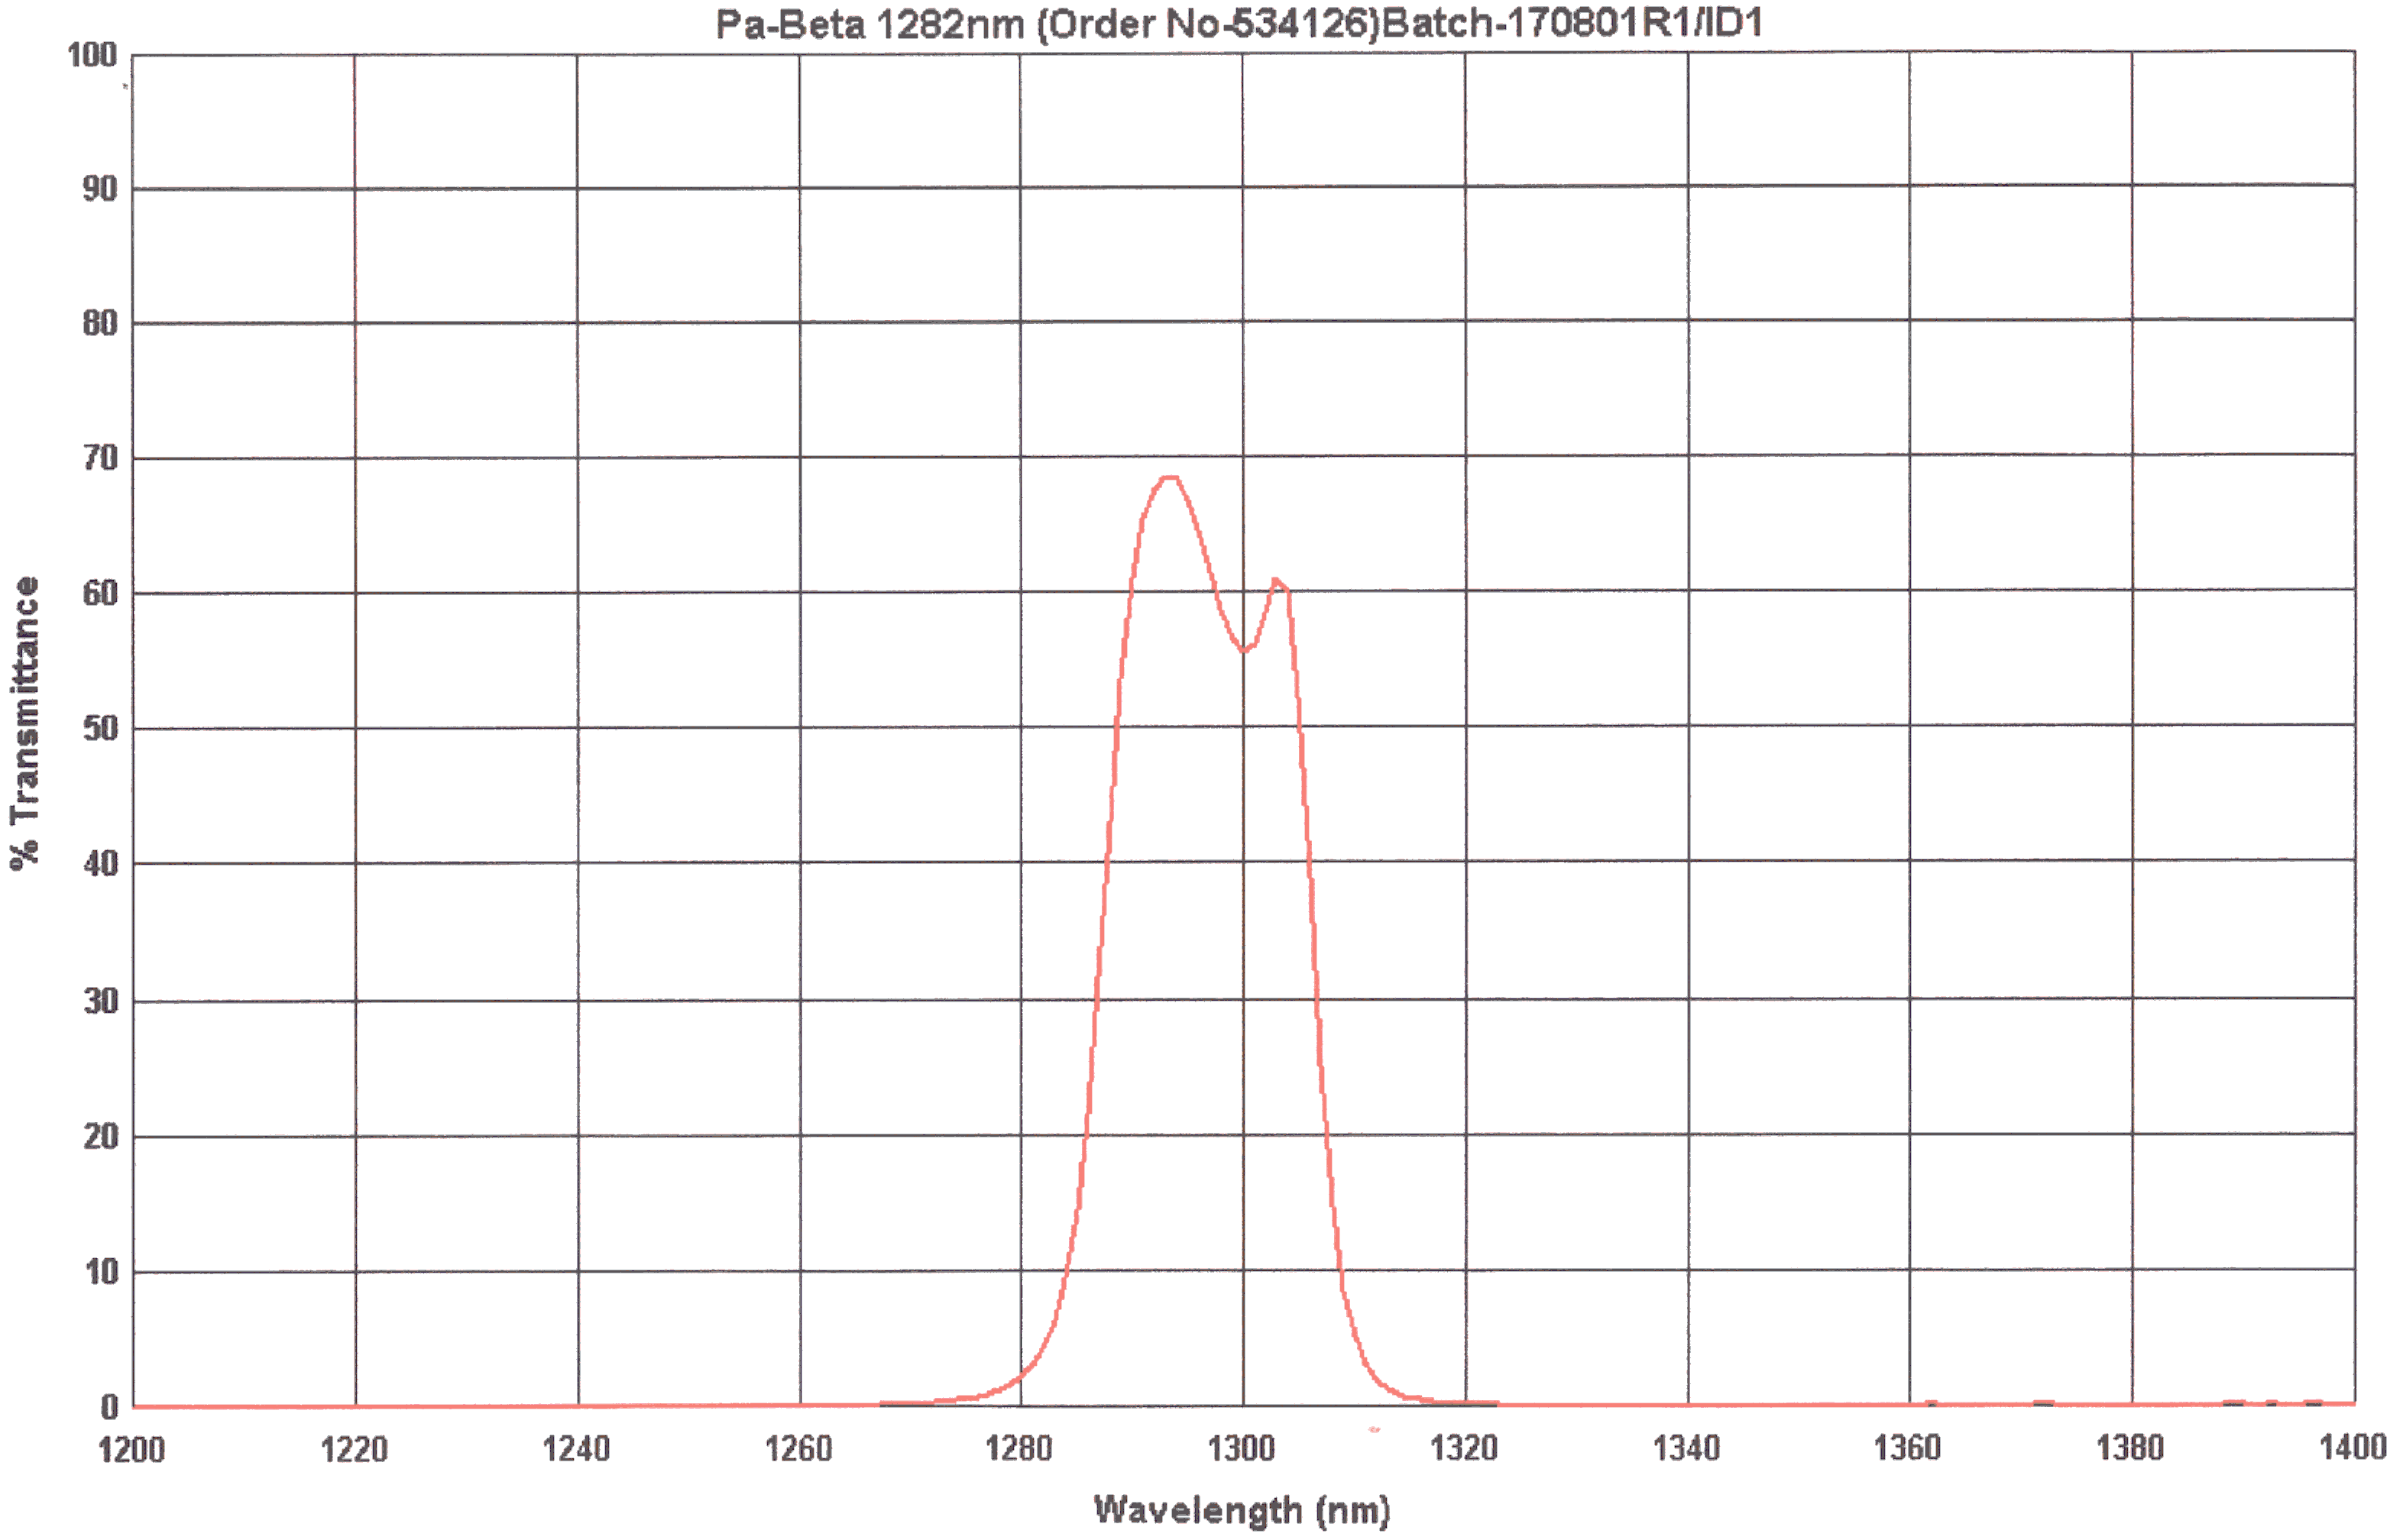
| Pa-Beta | Pa-Beta Zoomed Graph | Pa-Bata Original | Pa-Beta Temp & Tilt | NDC |
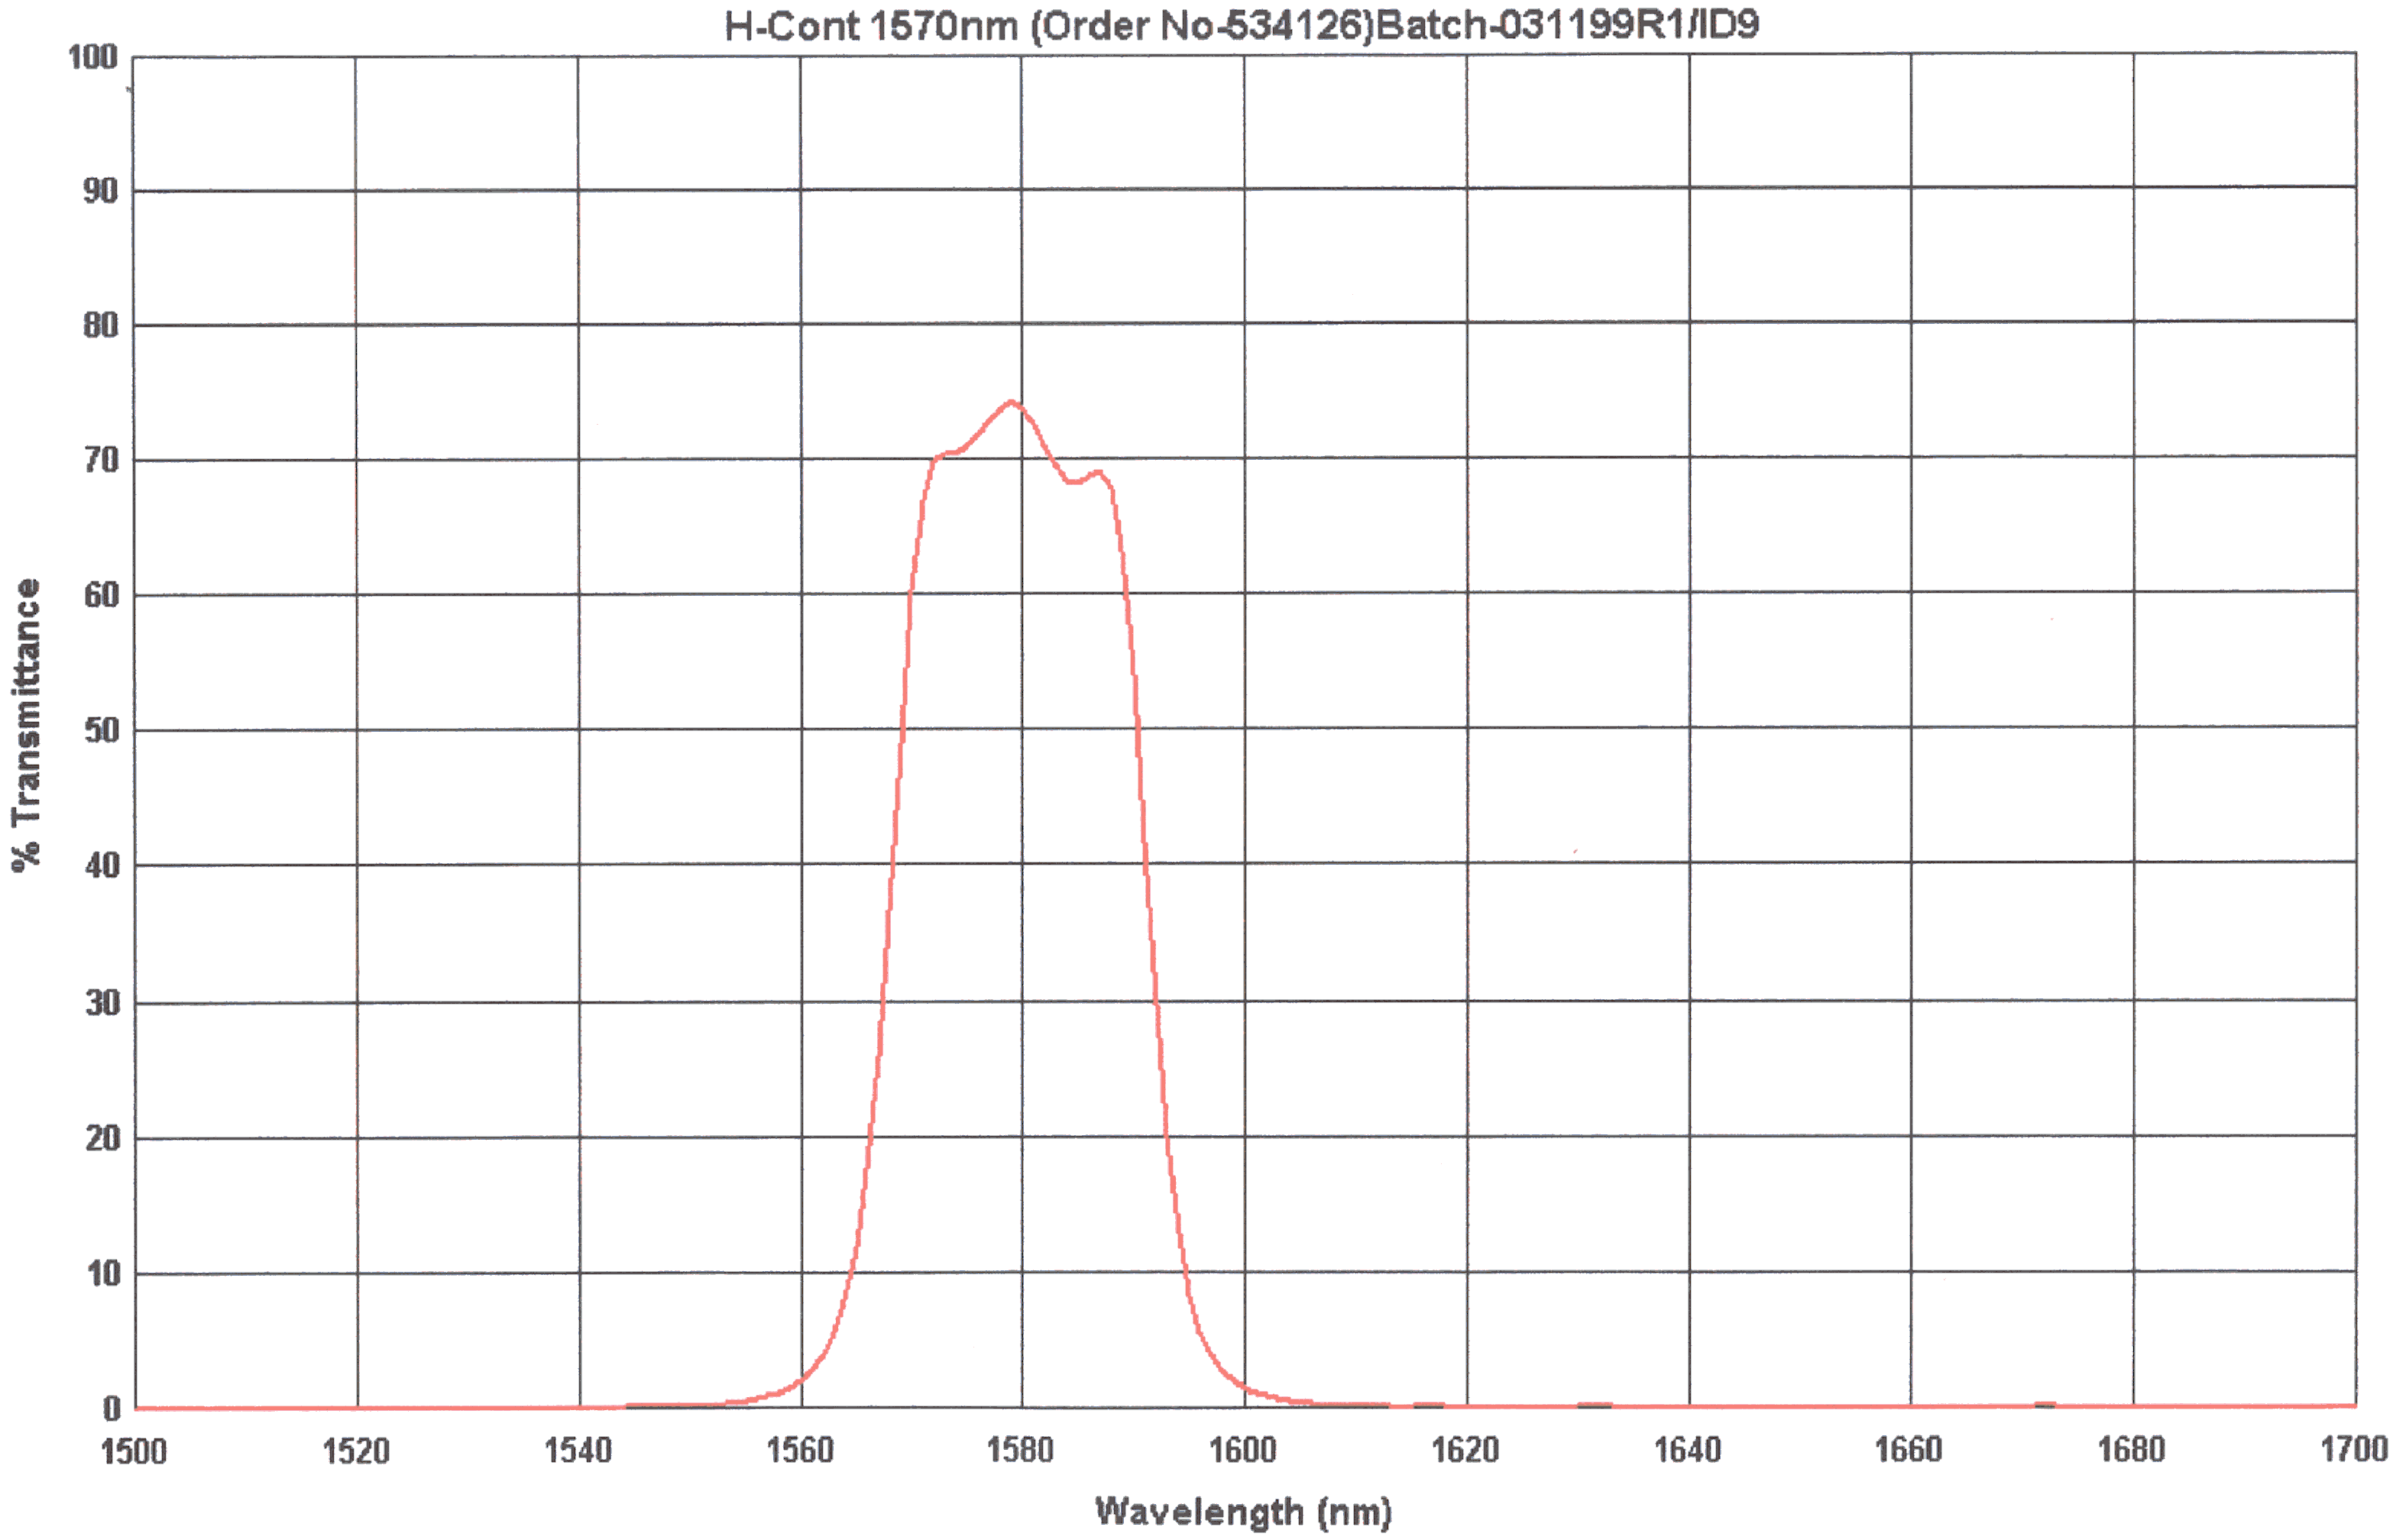
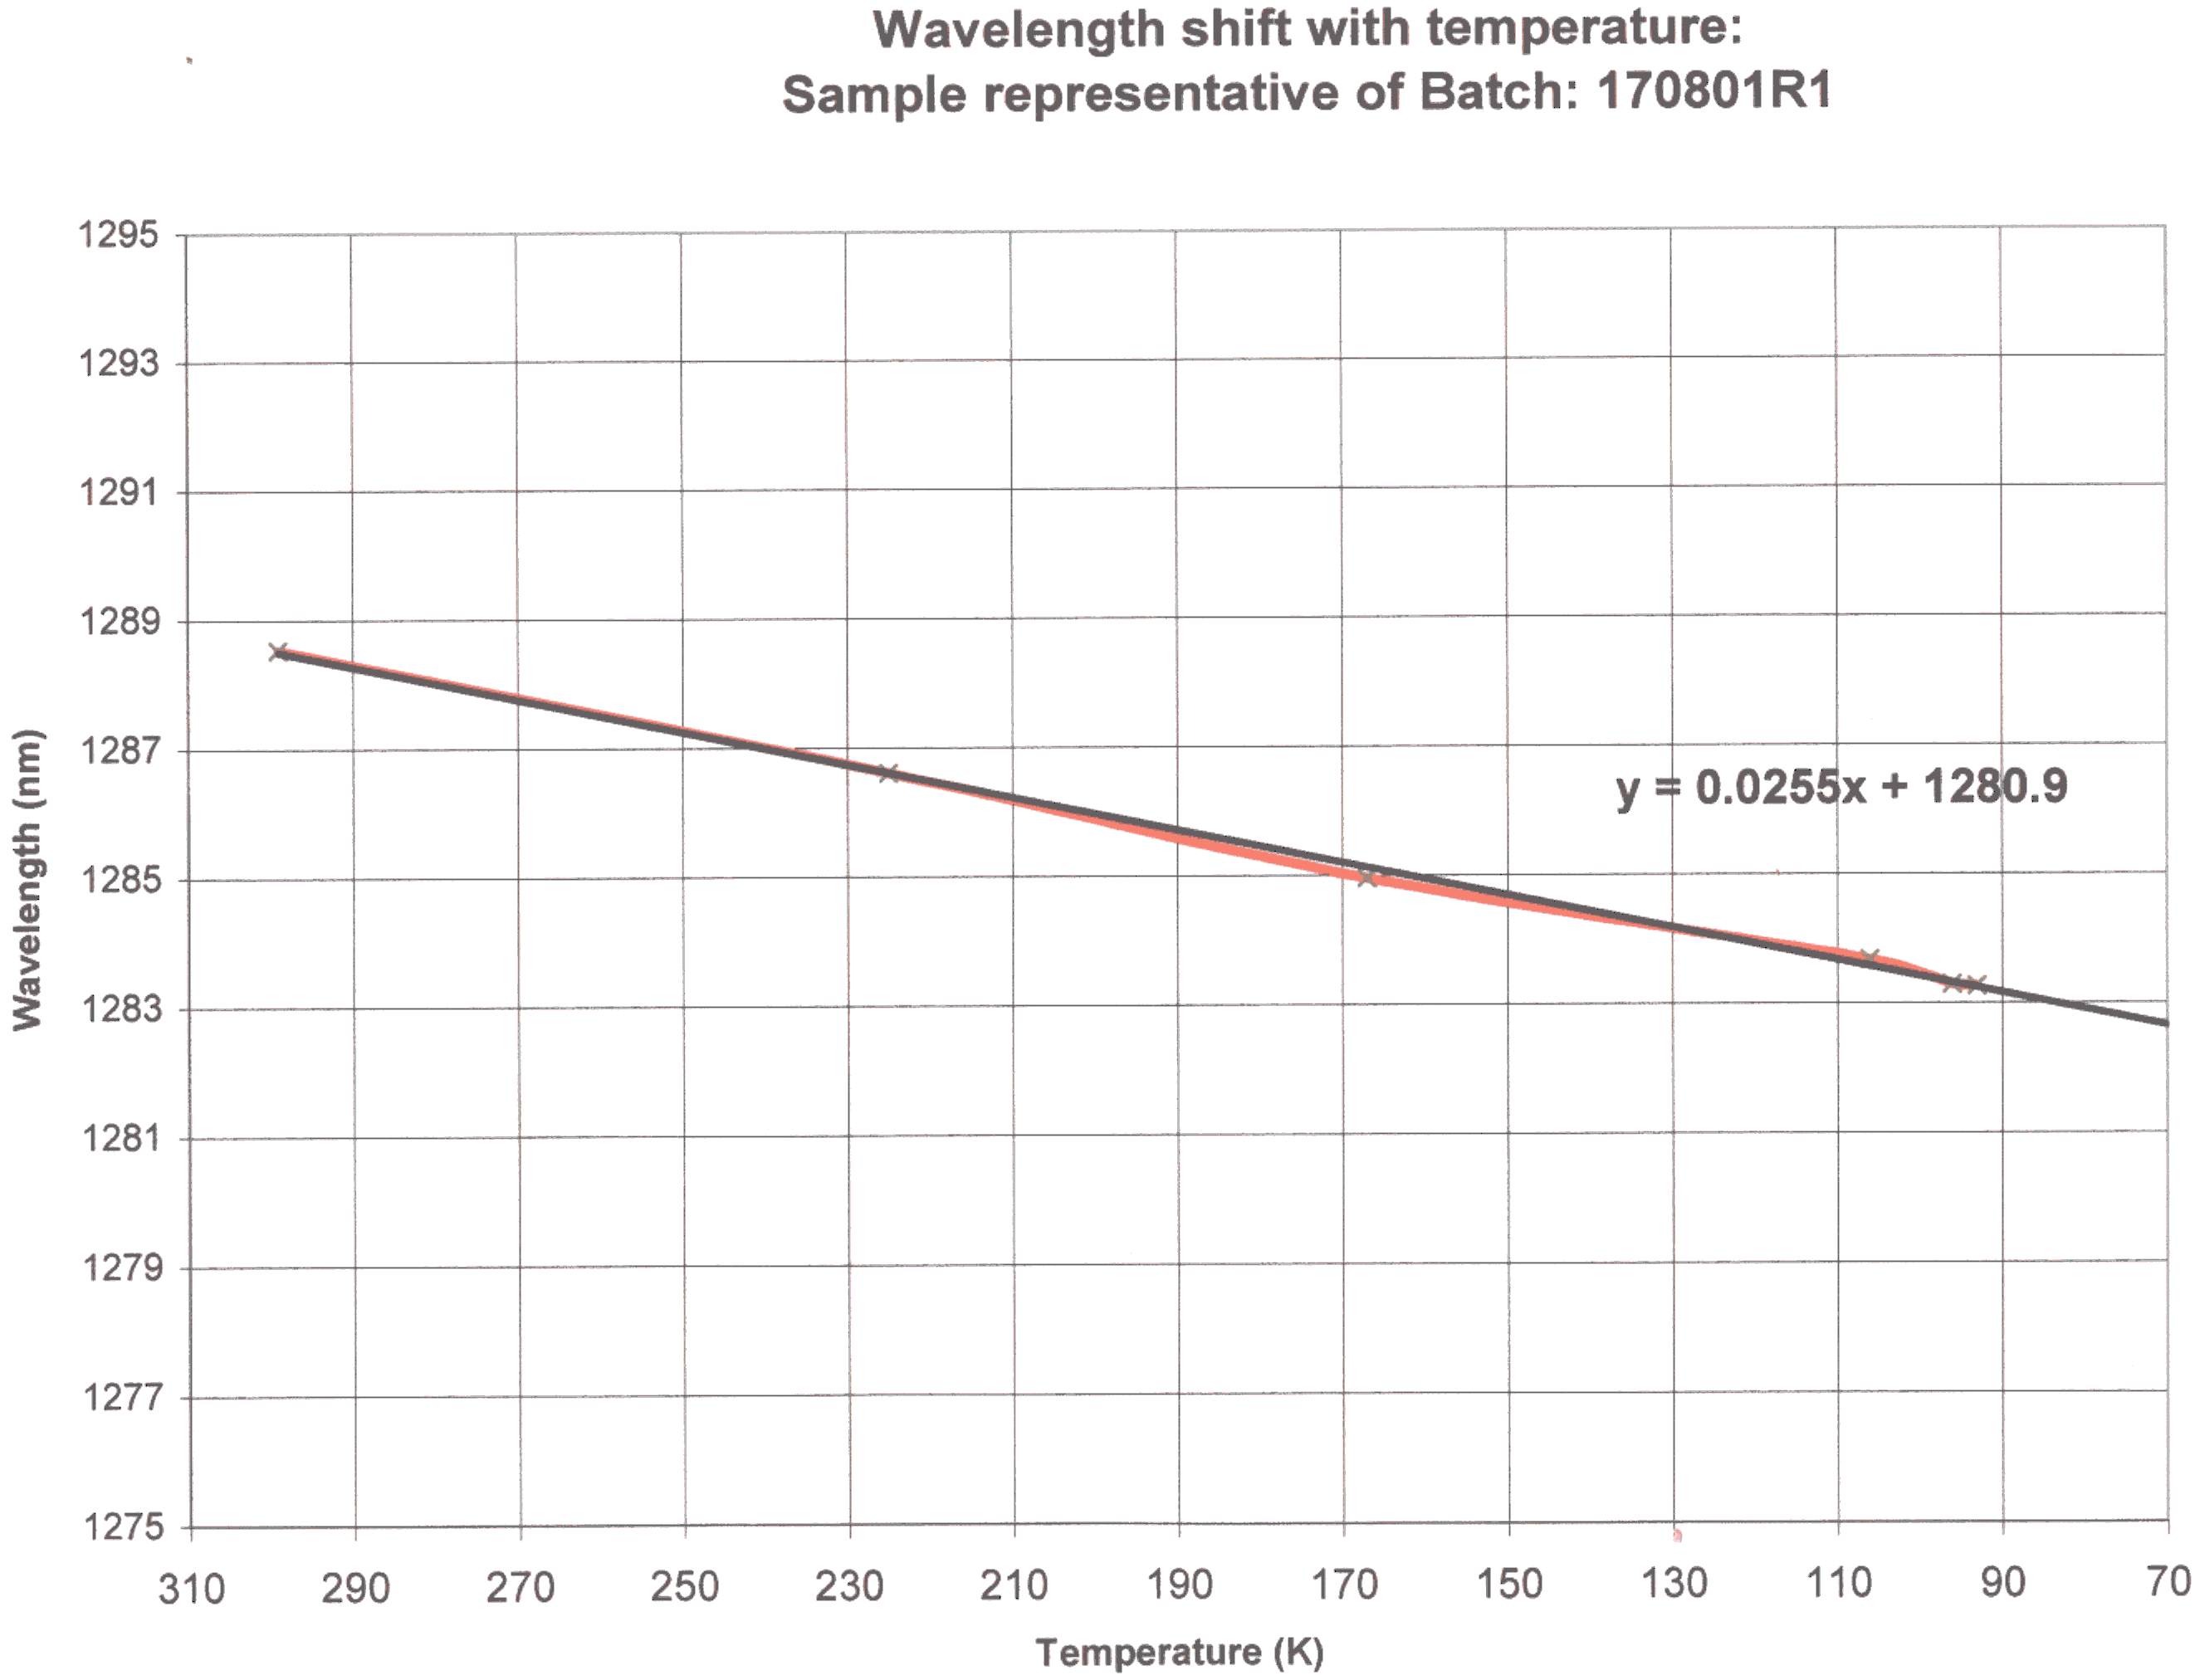
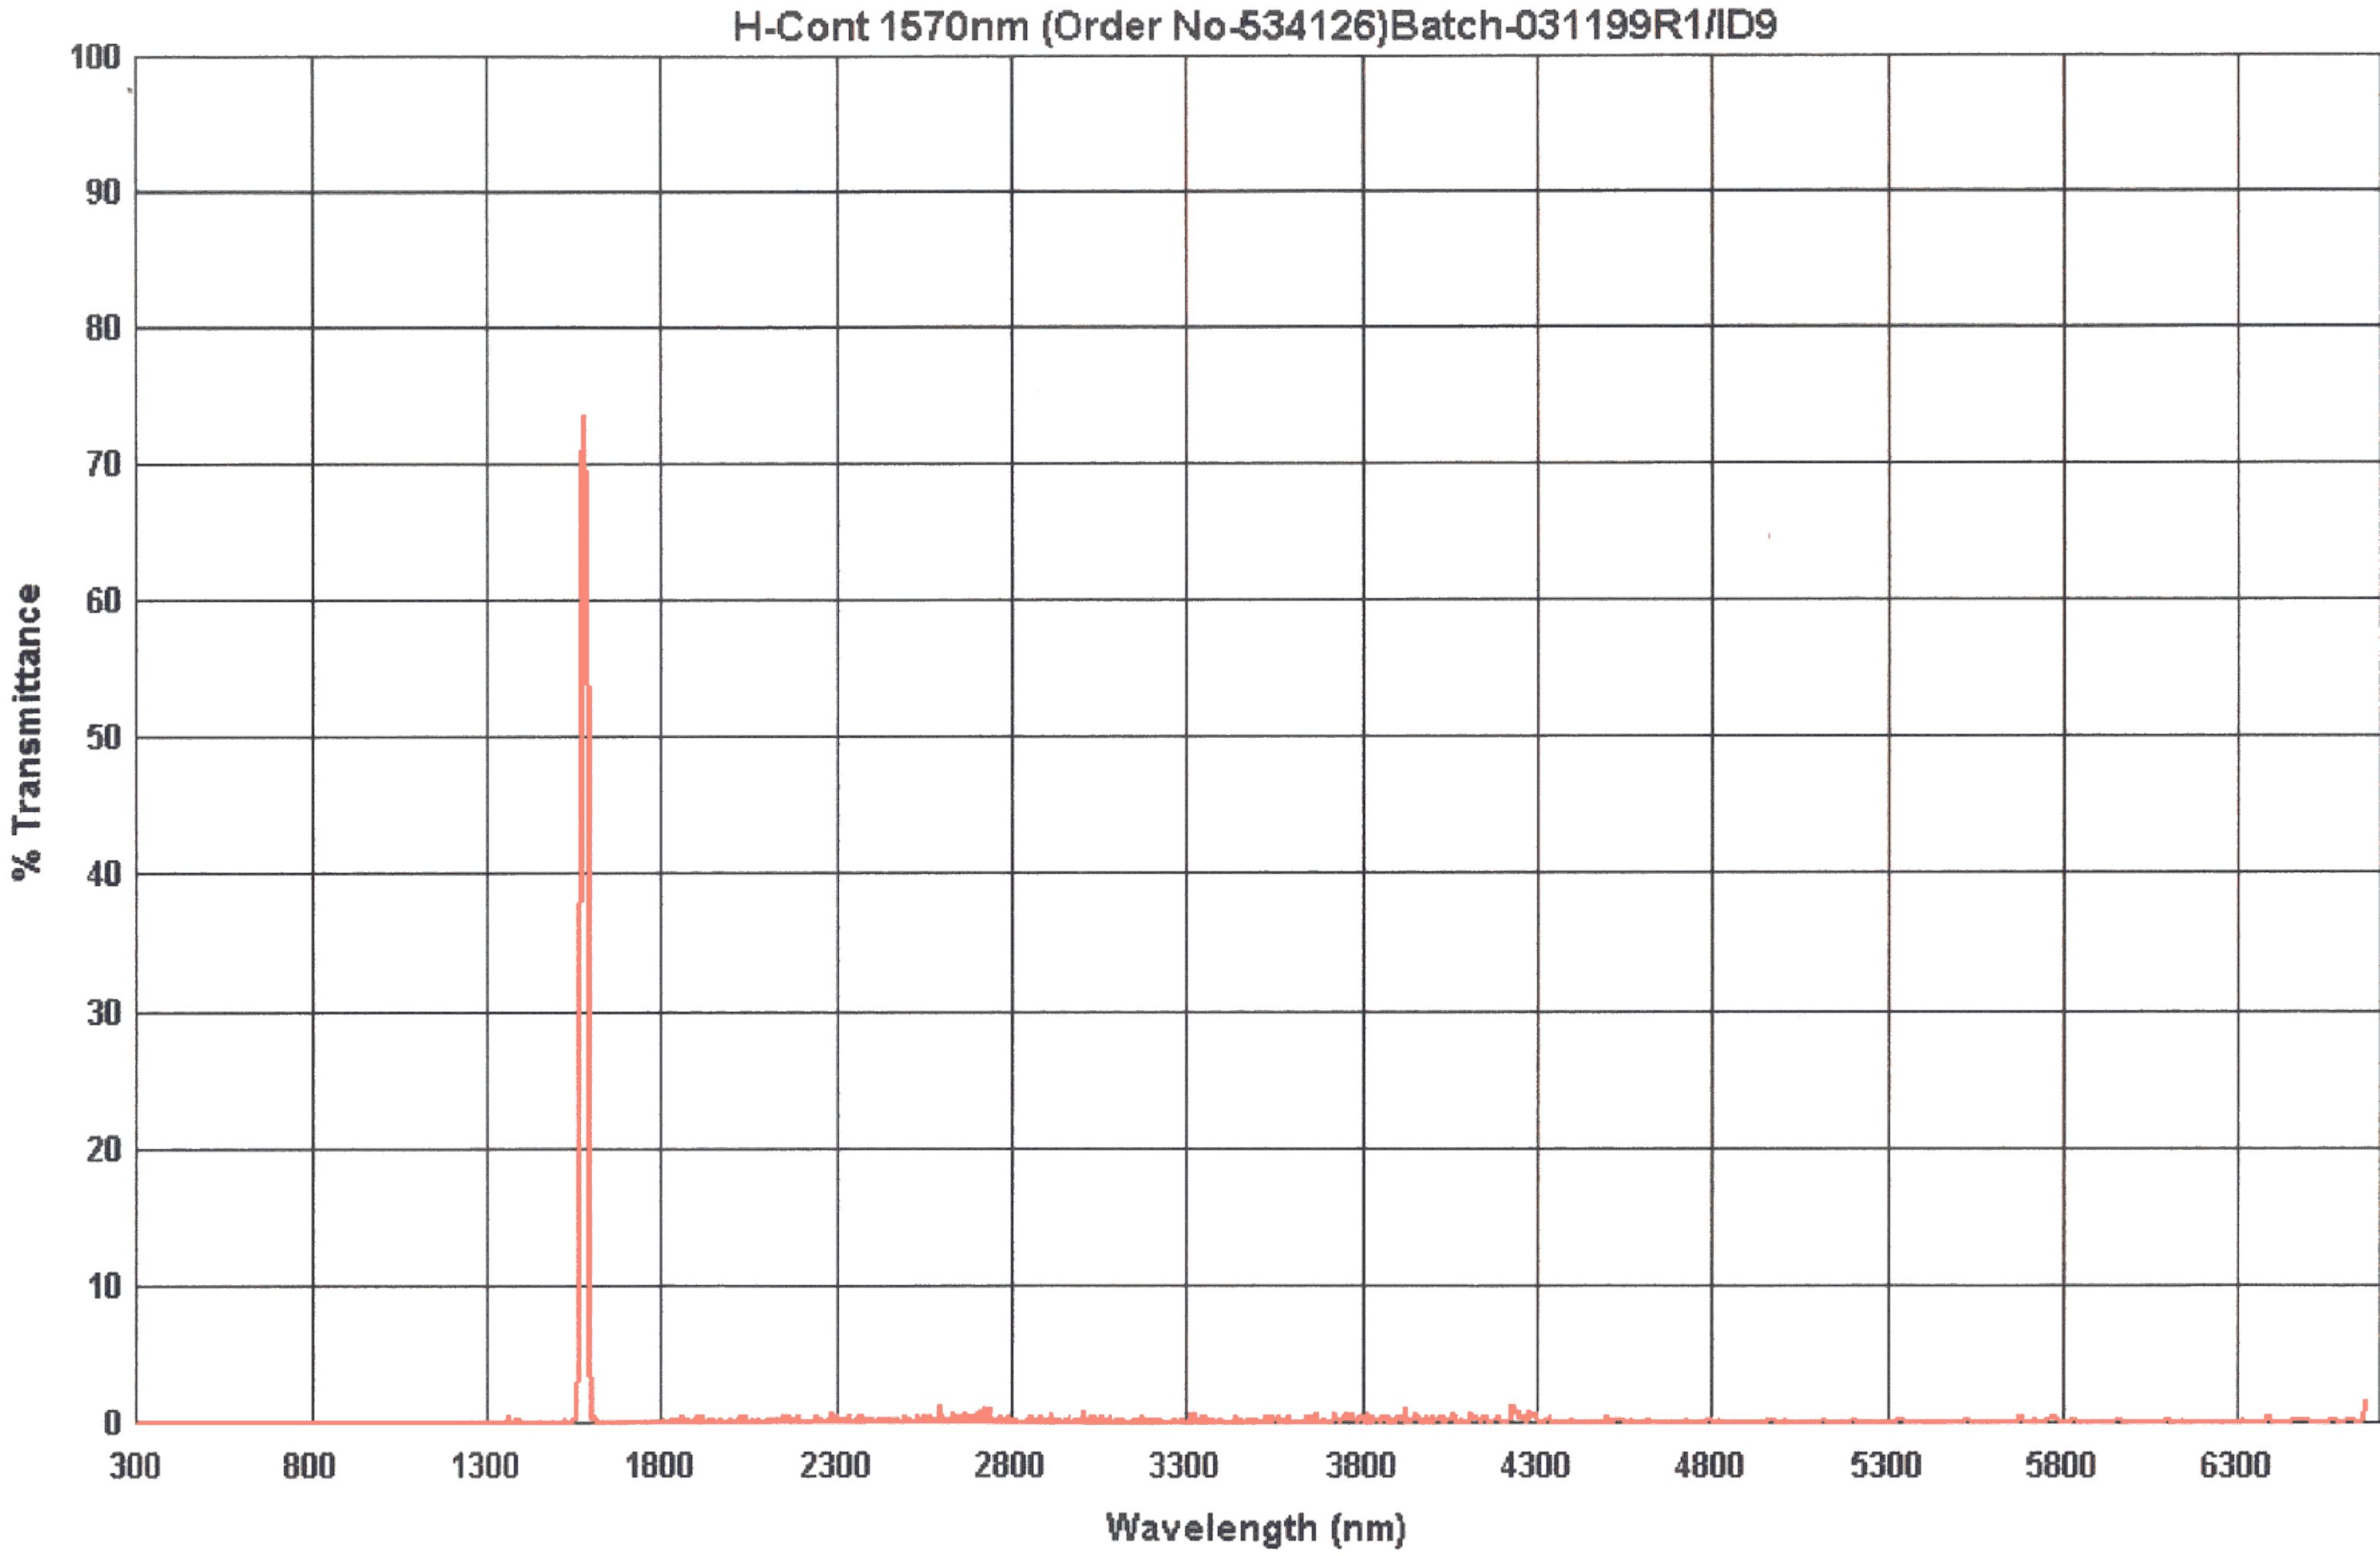
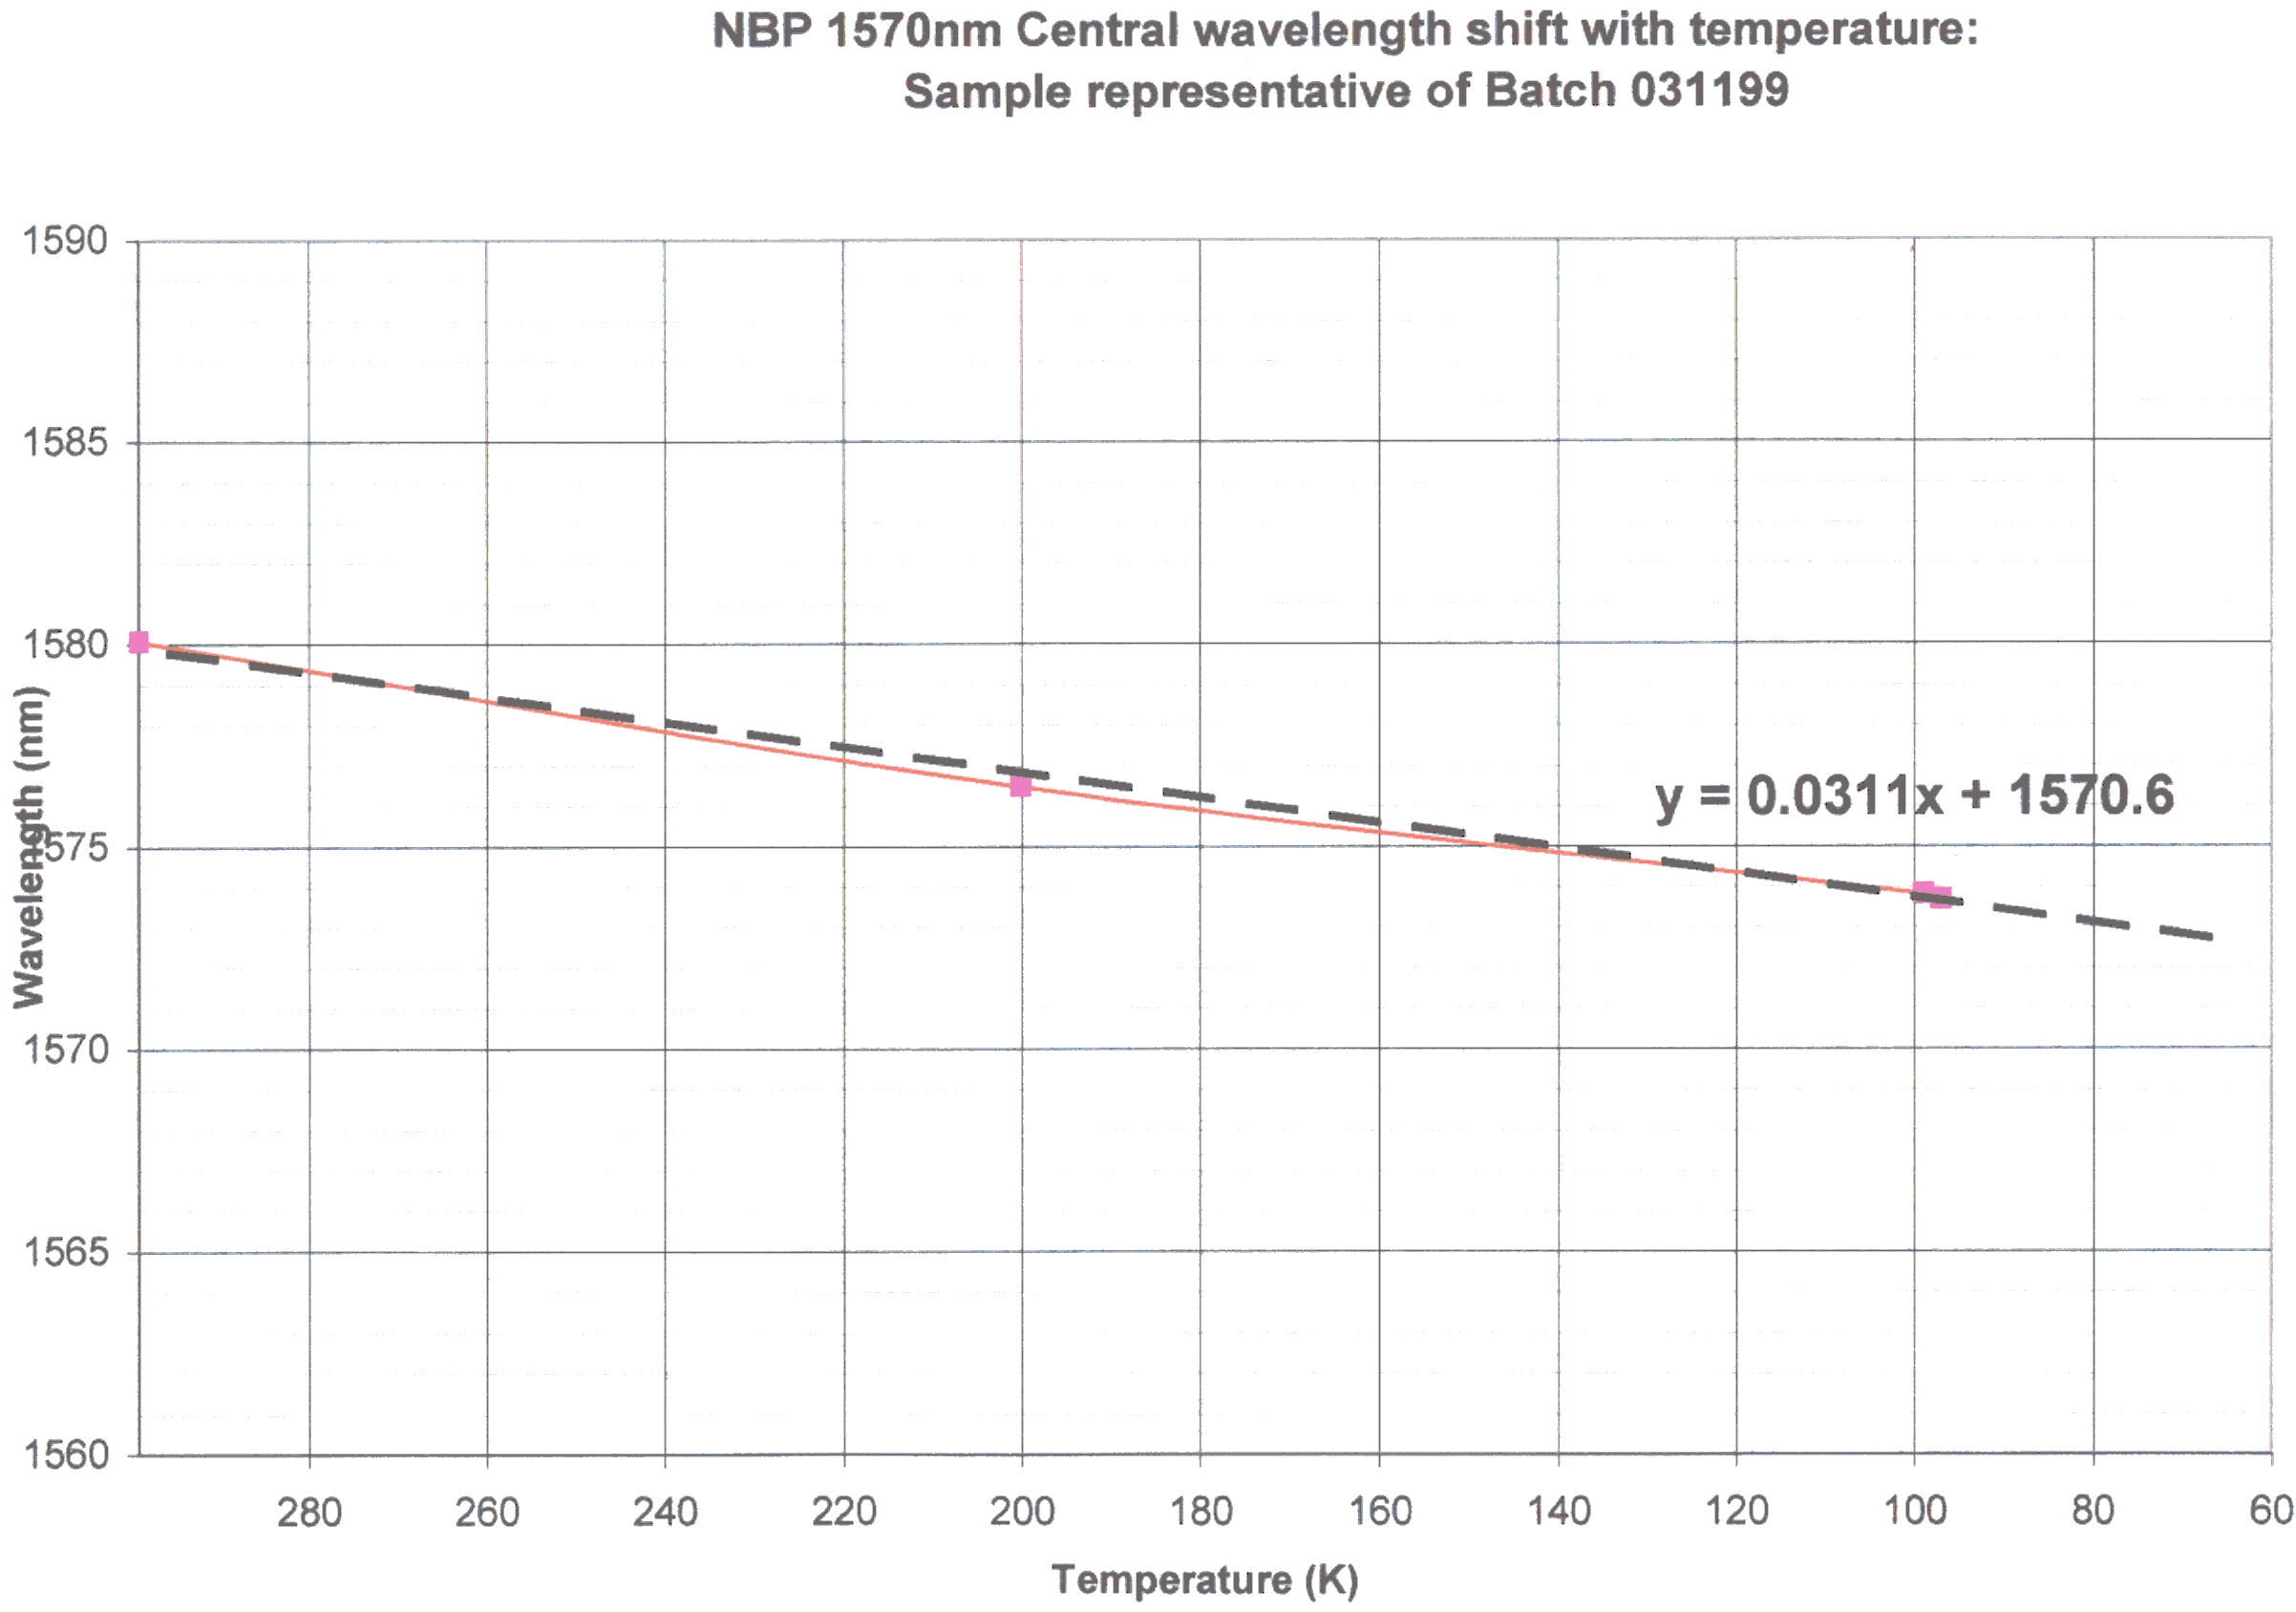
| H-Cont | H-Cont Zoomed Graph | H-Cont Original | H-Cont Temp & Tilt | NDC |
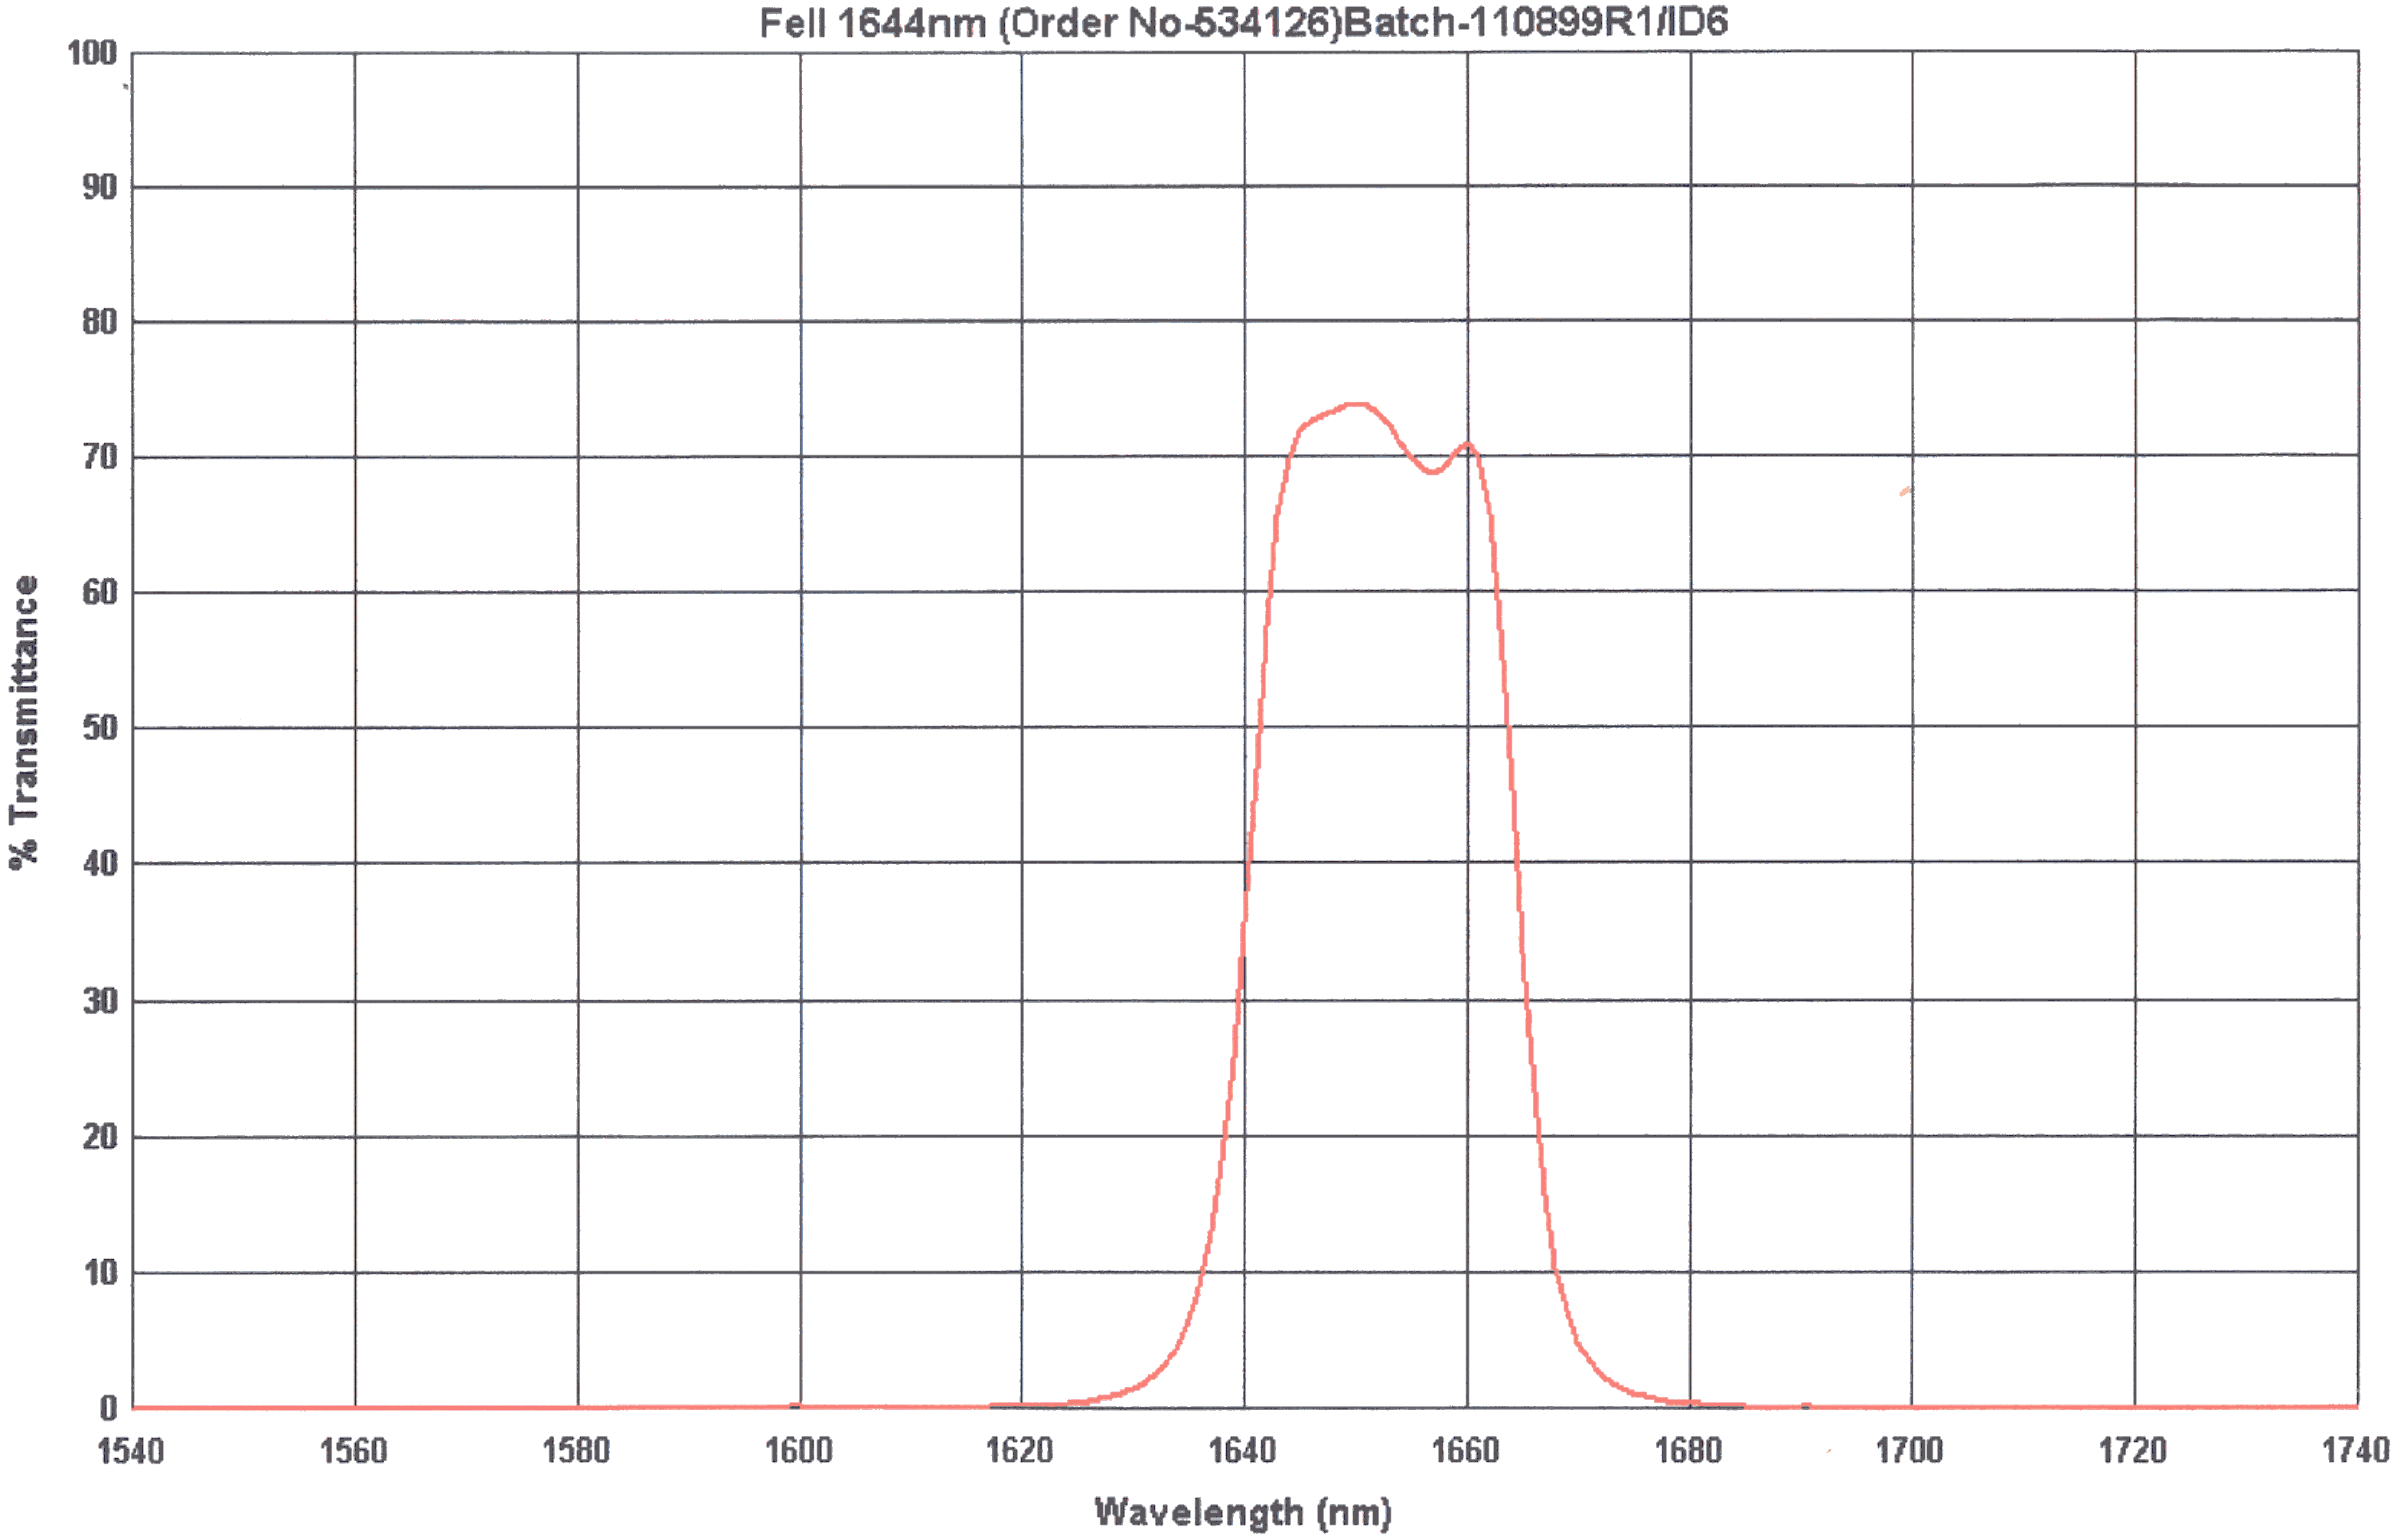
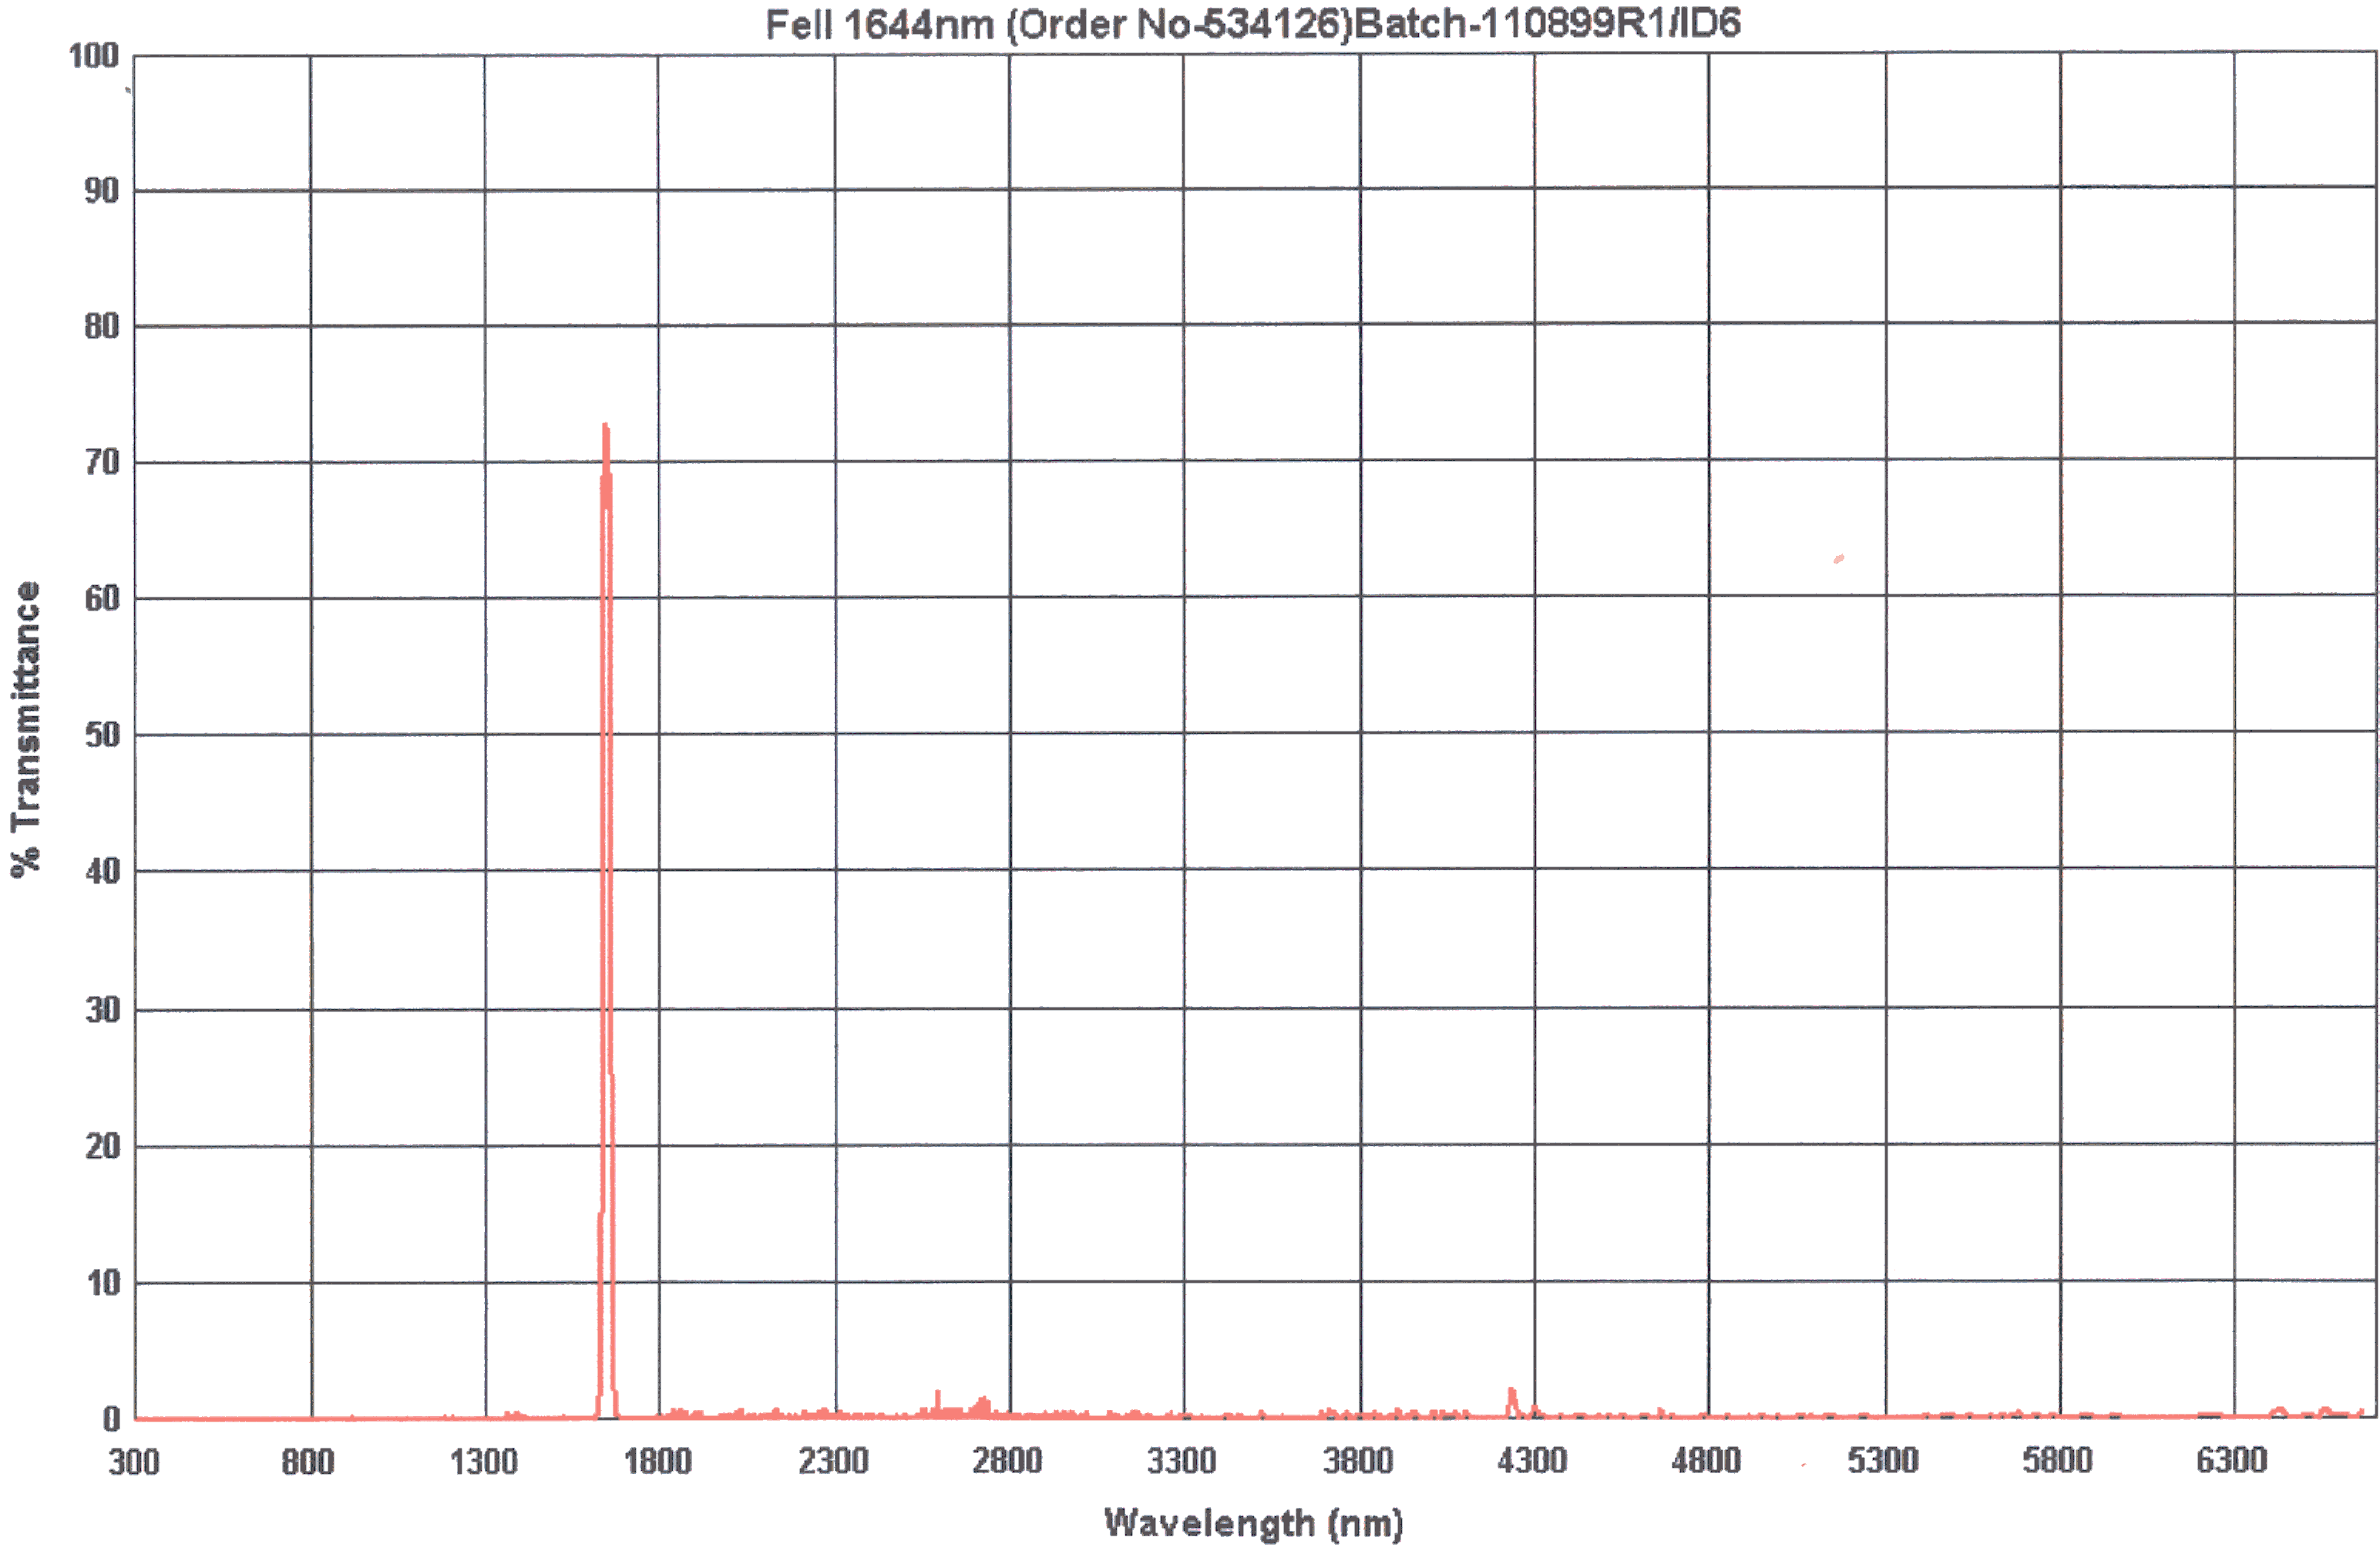
| Fe-II | Fe-II Zoomed Graph | Fe-II Original | Fe-II Temp & Tilt | NDC |
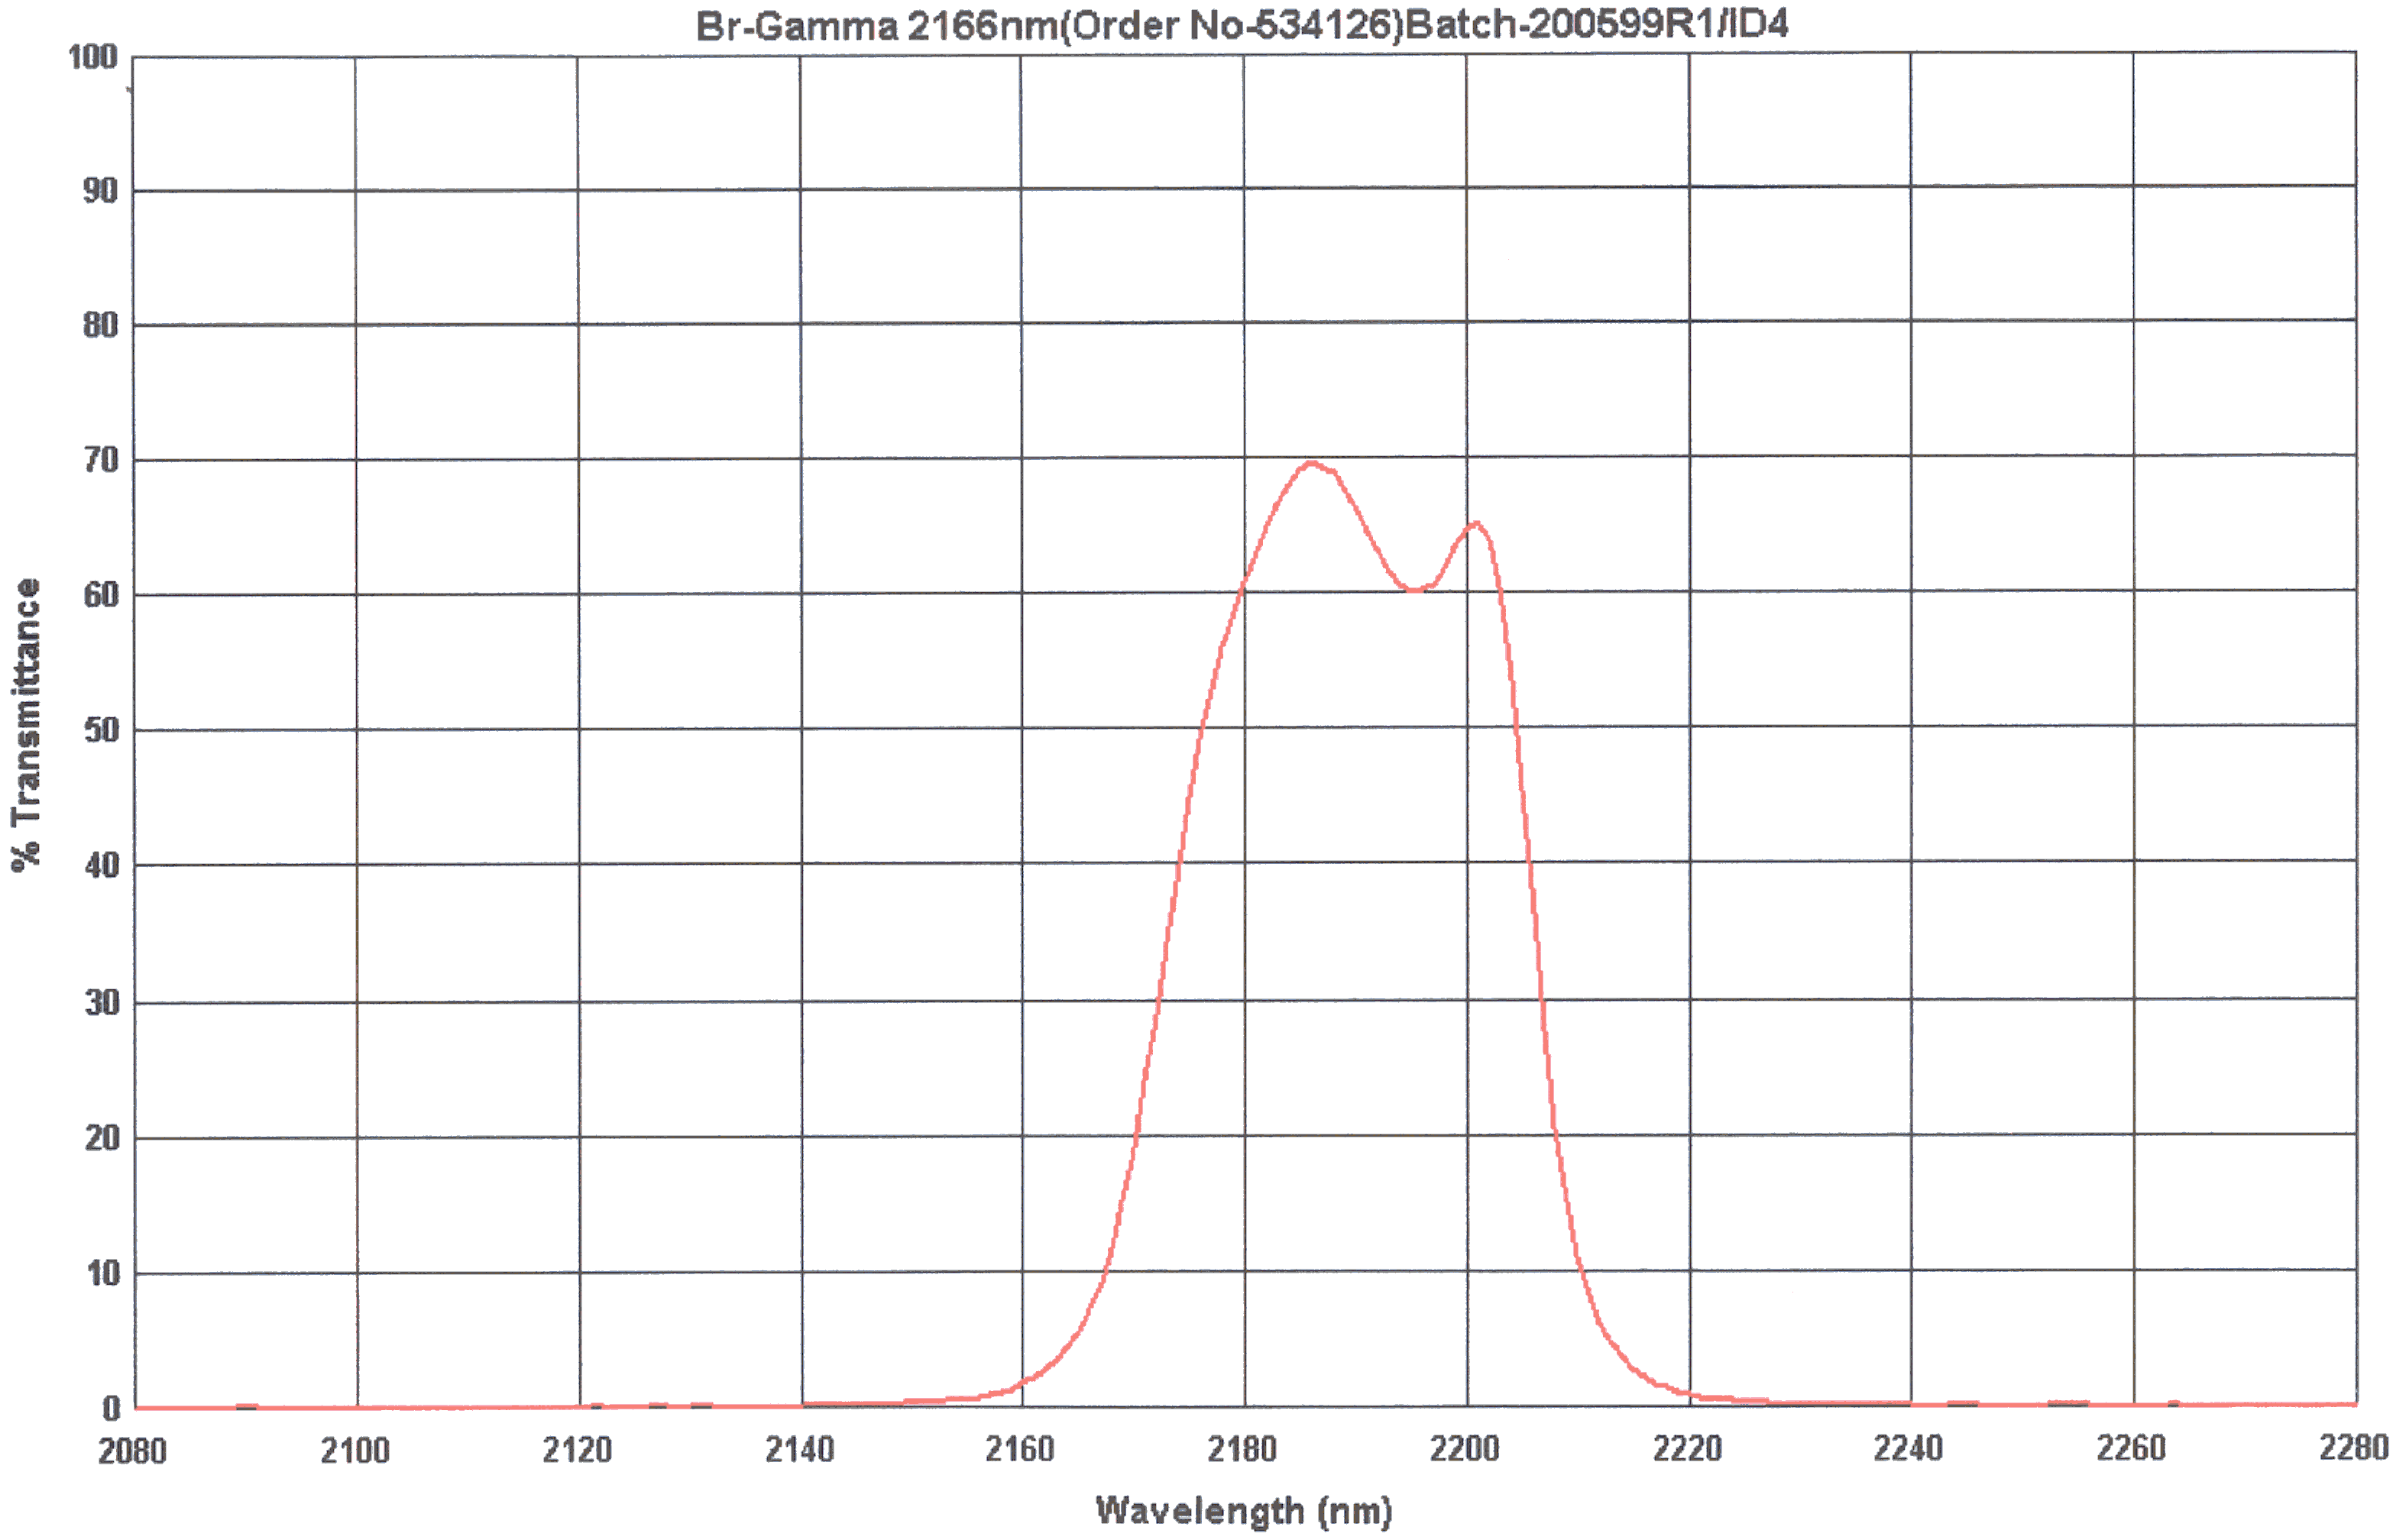
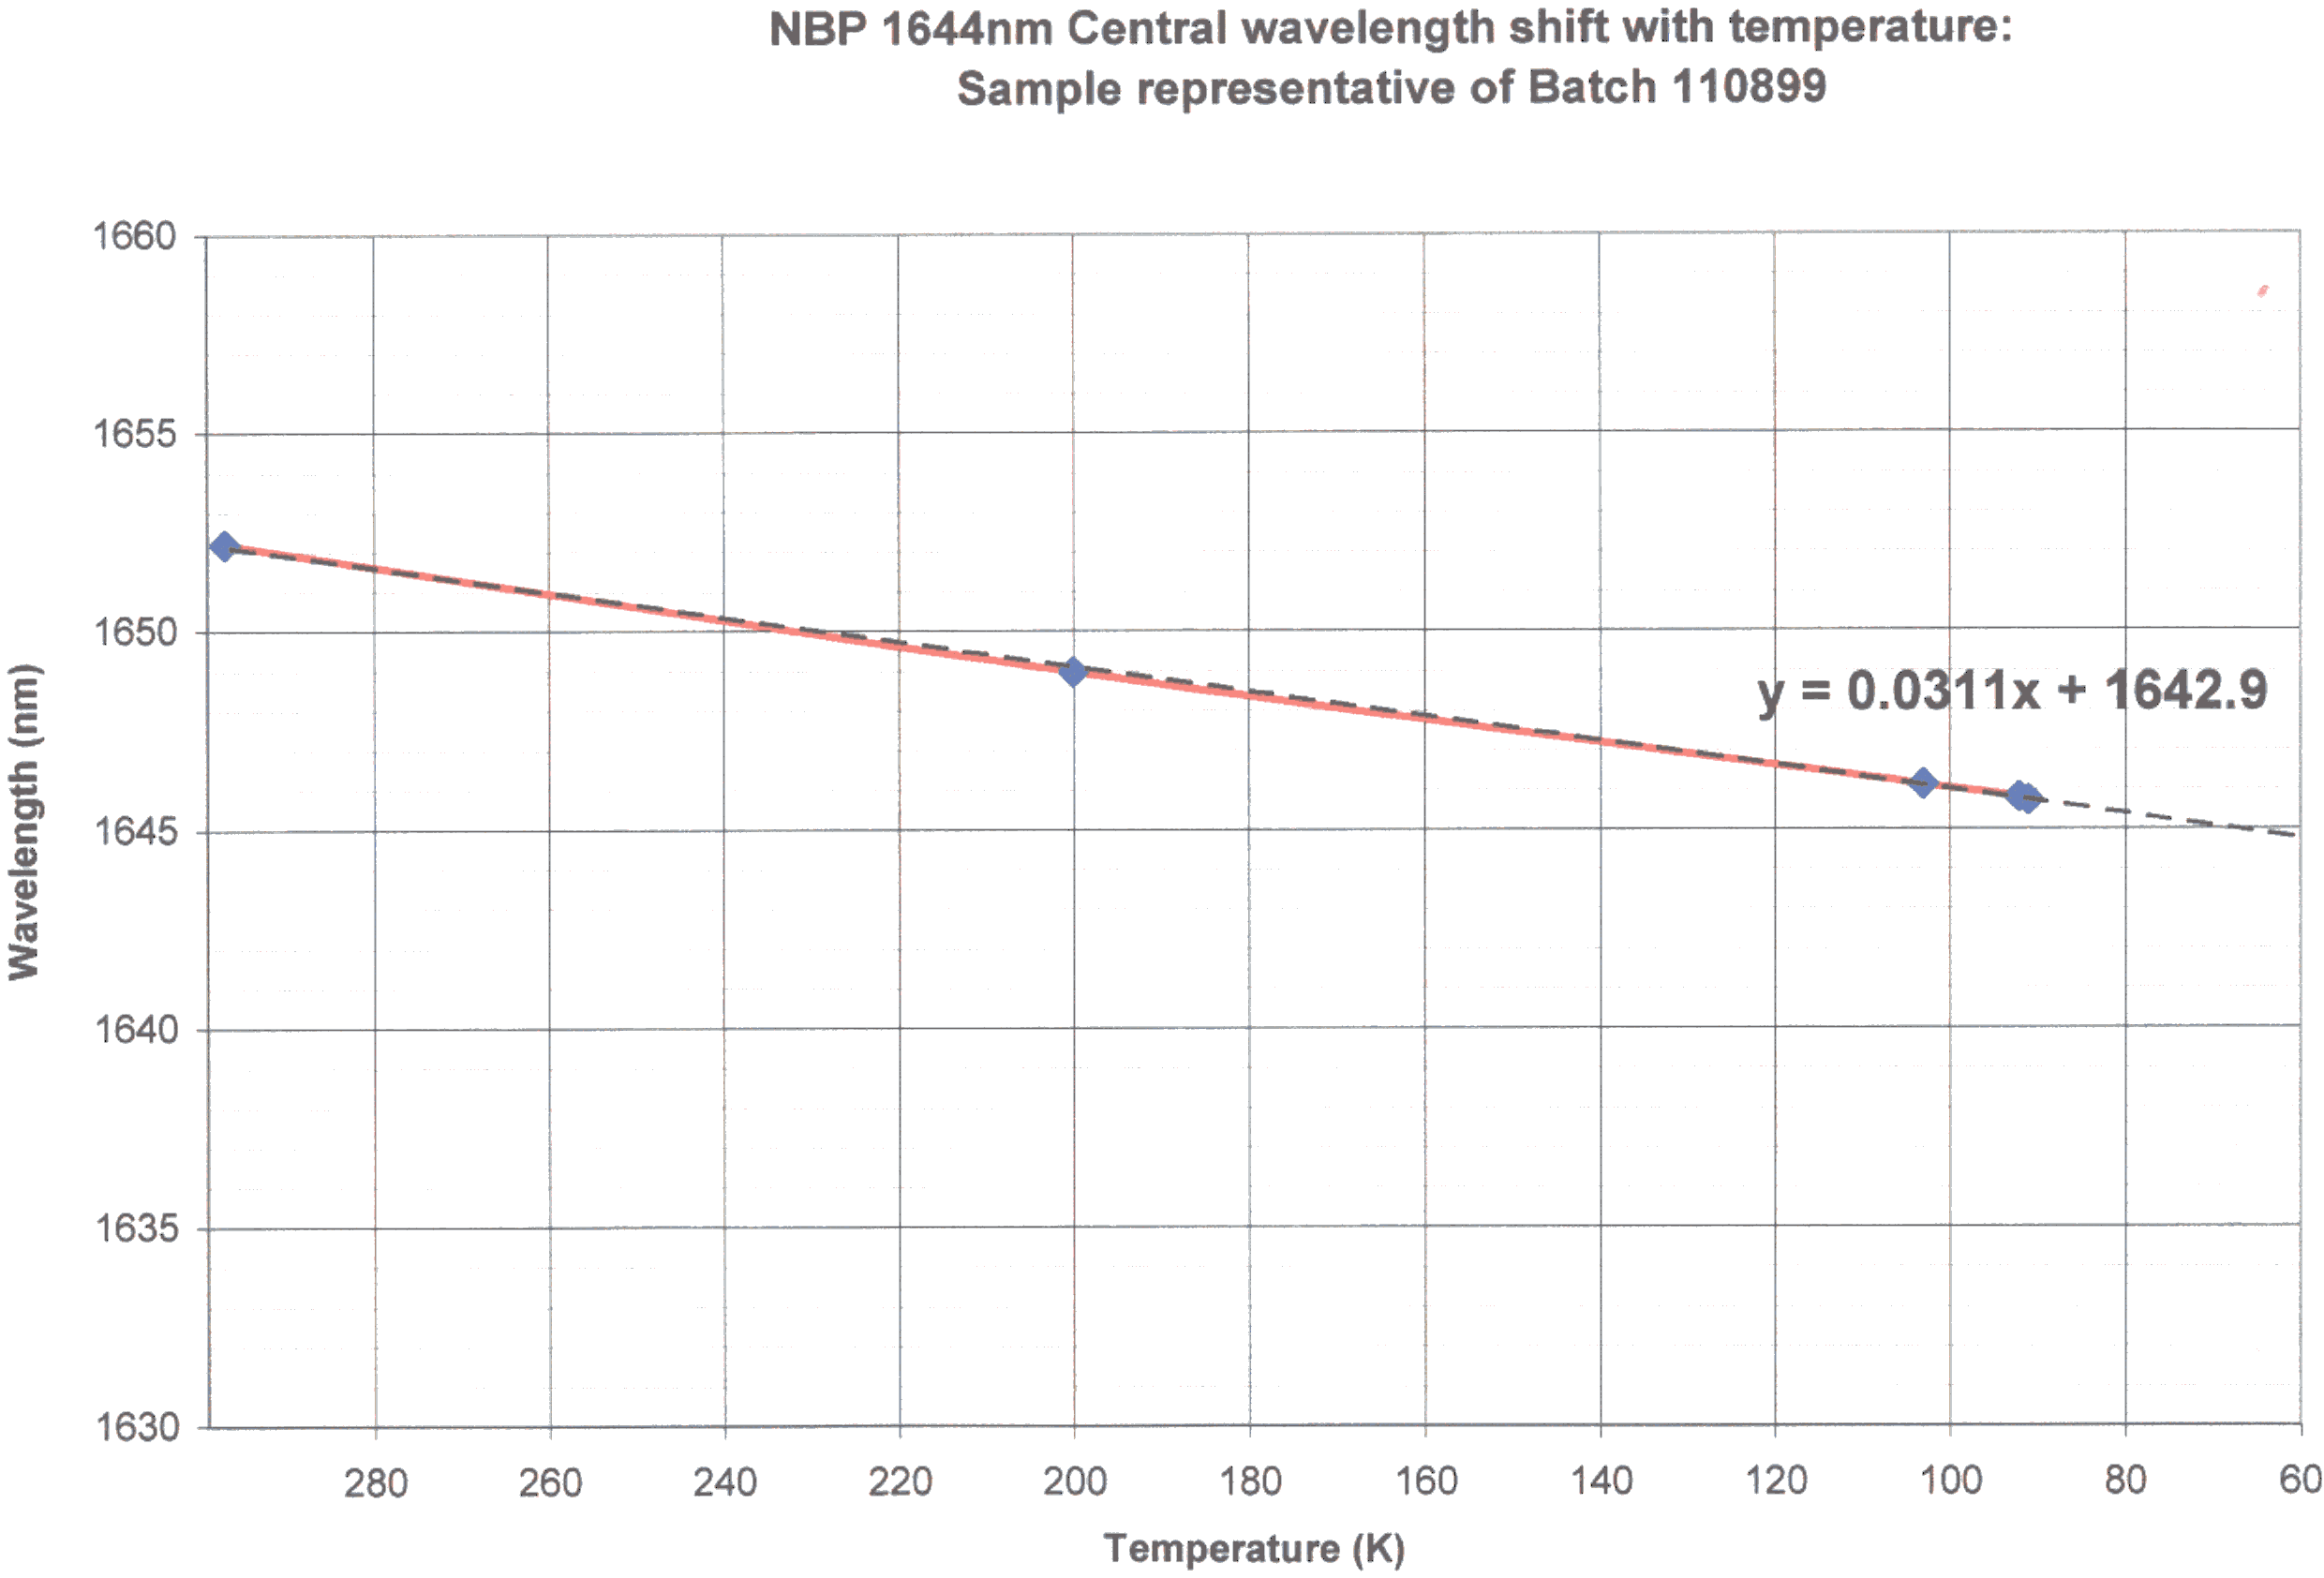
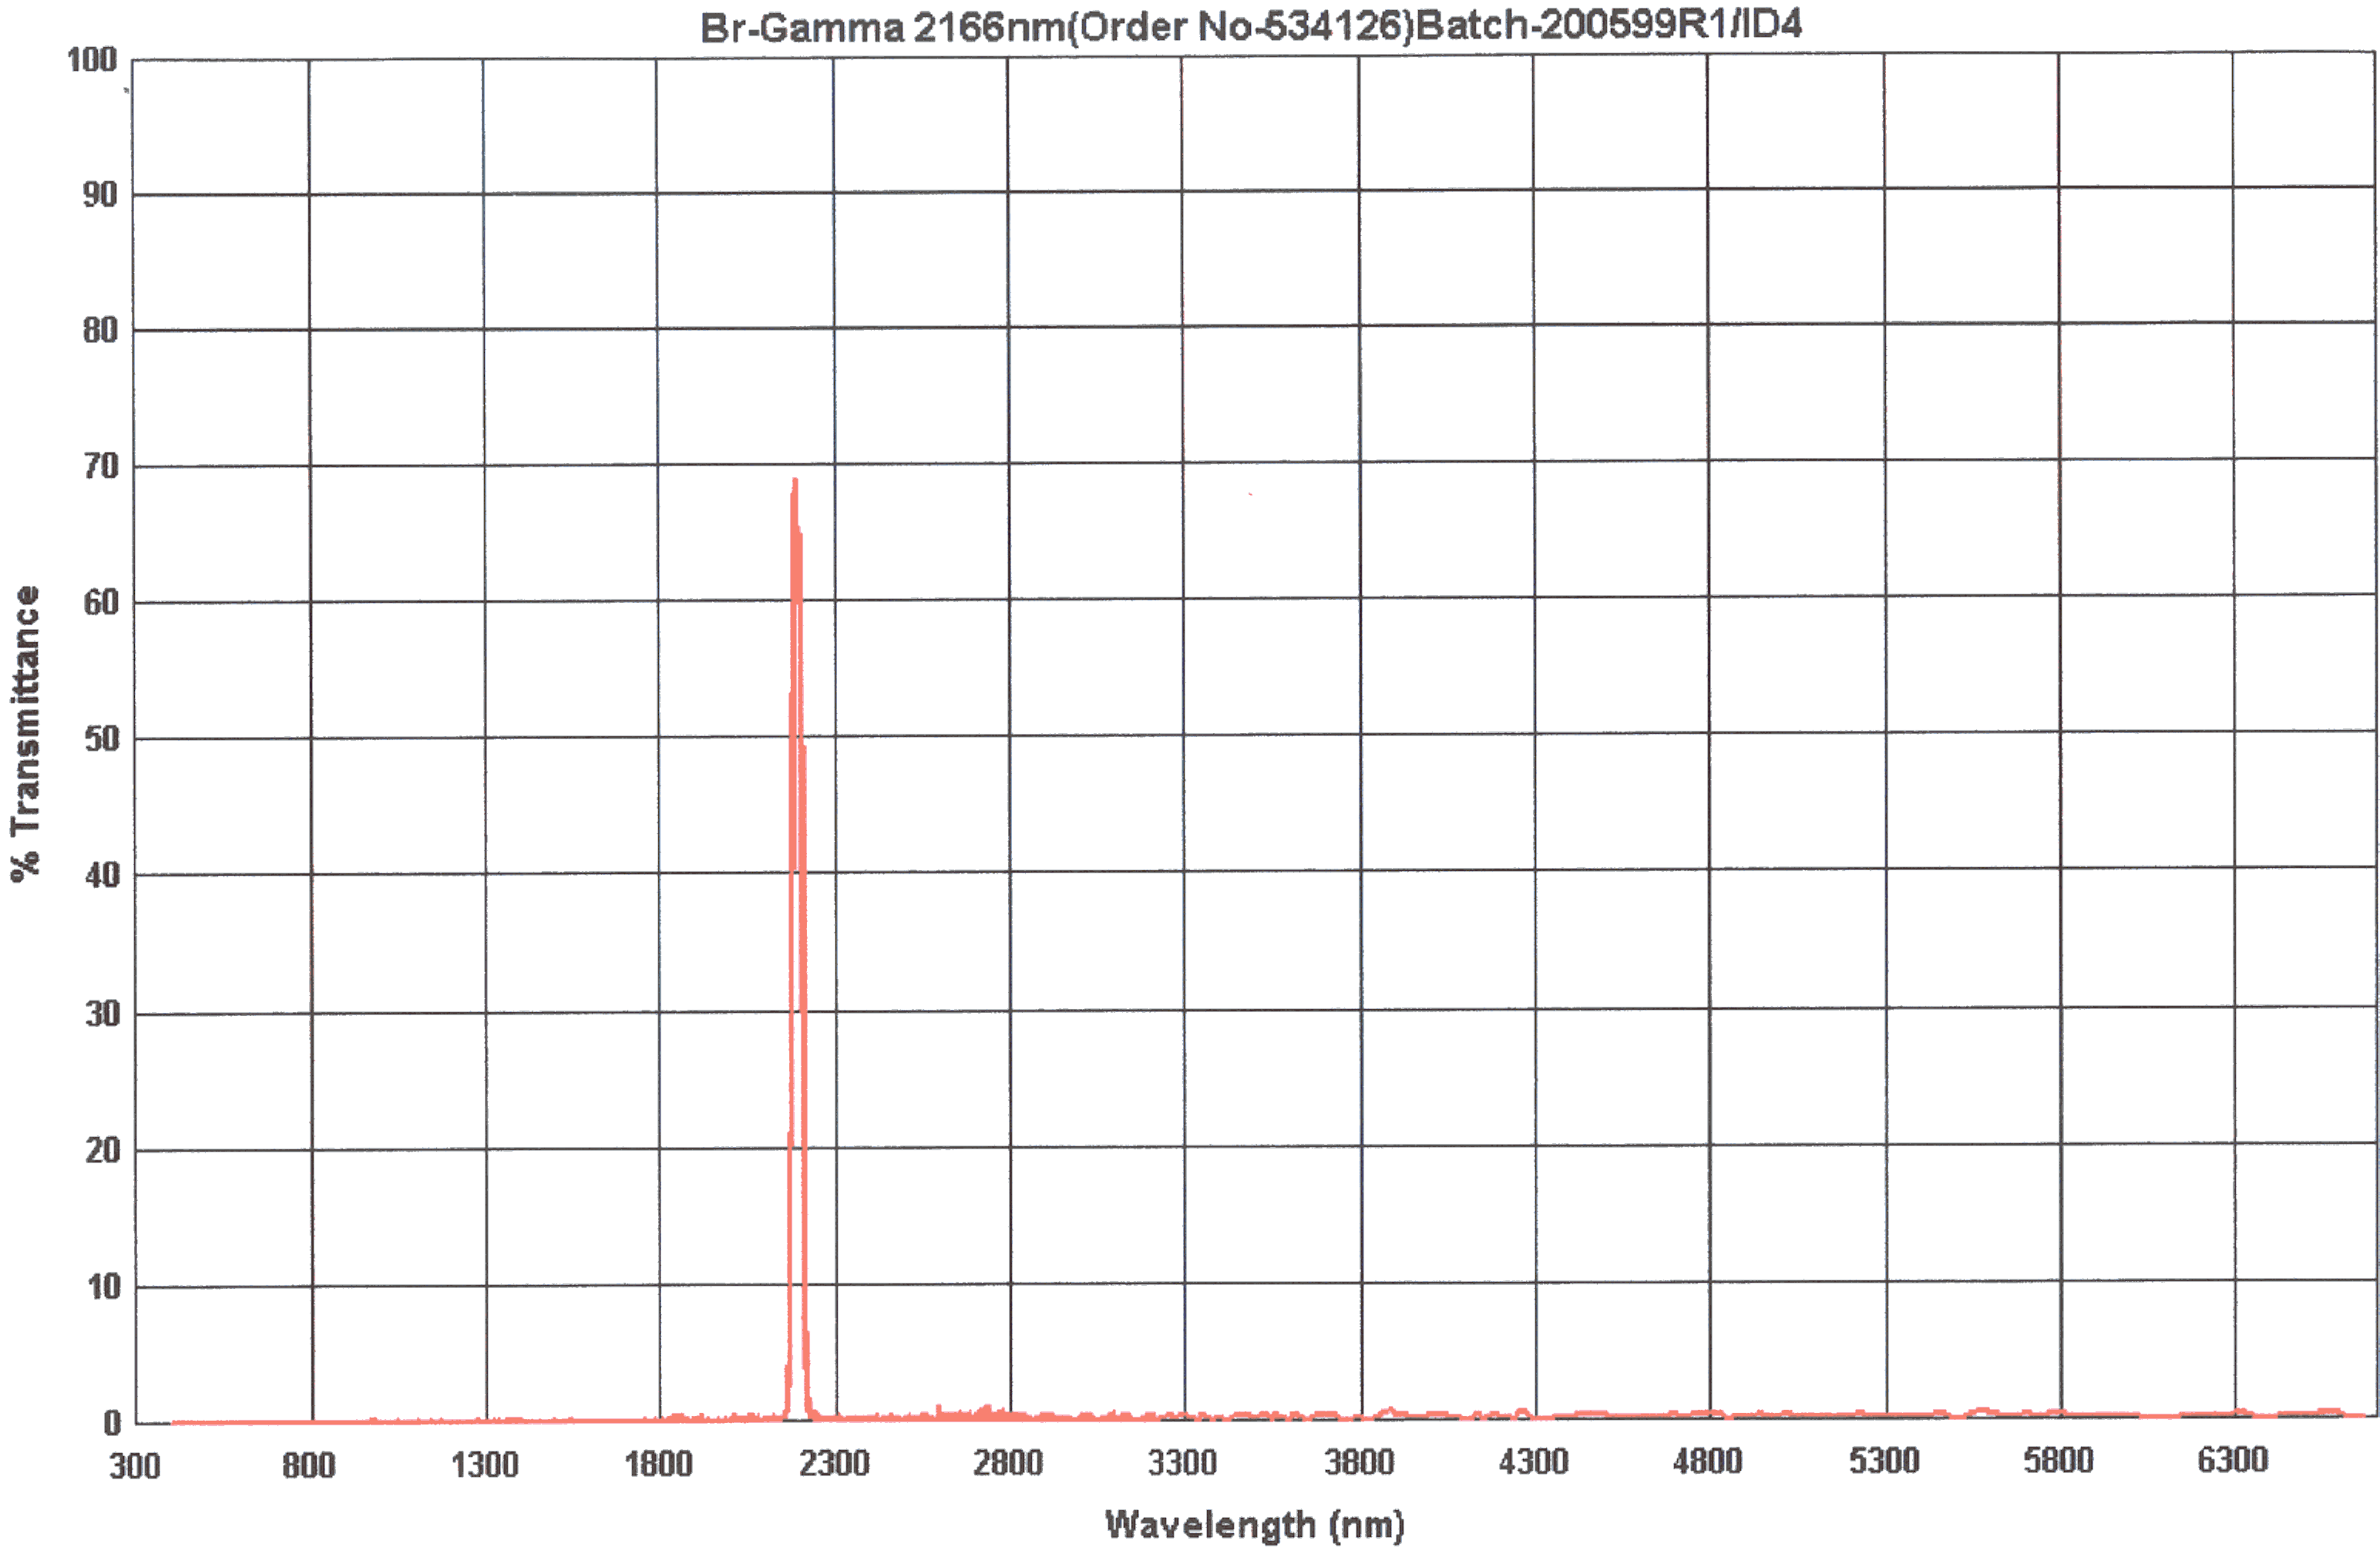
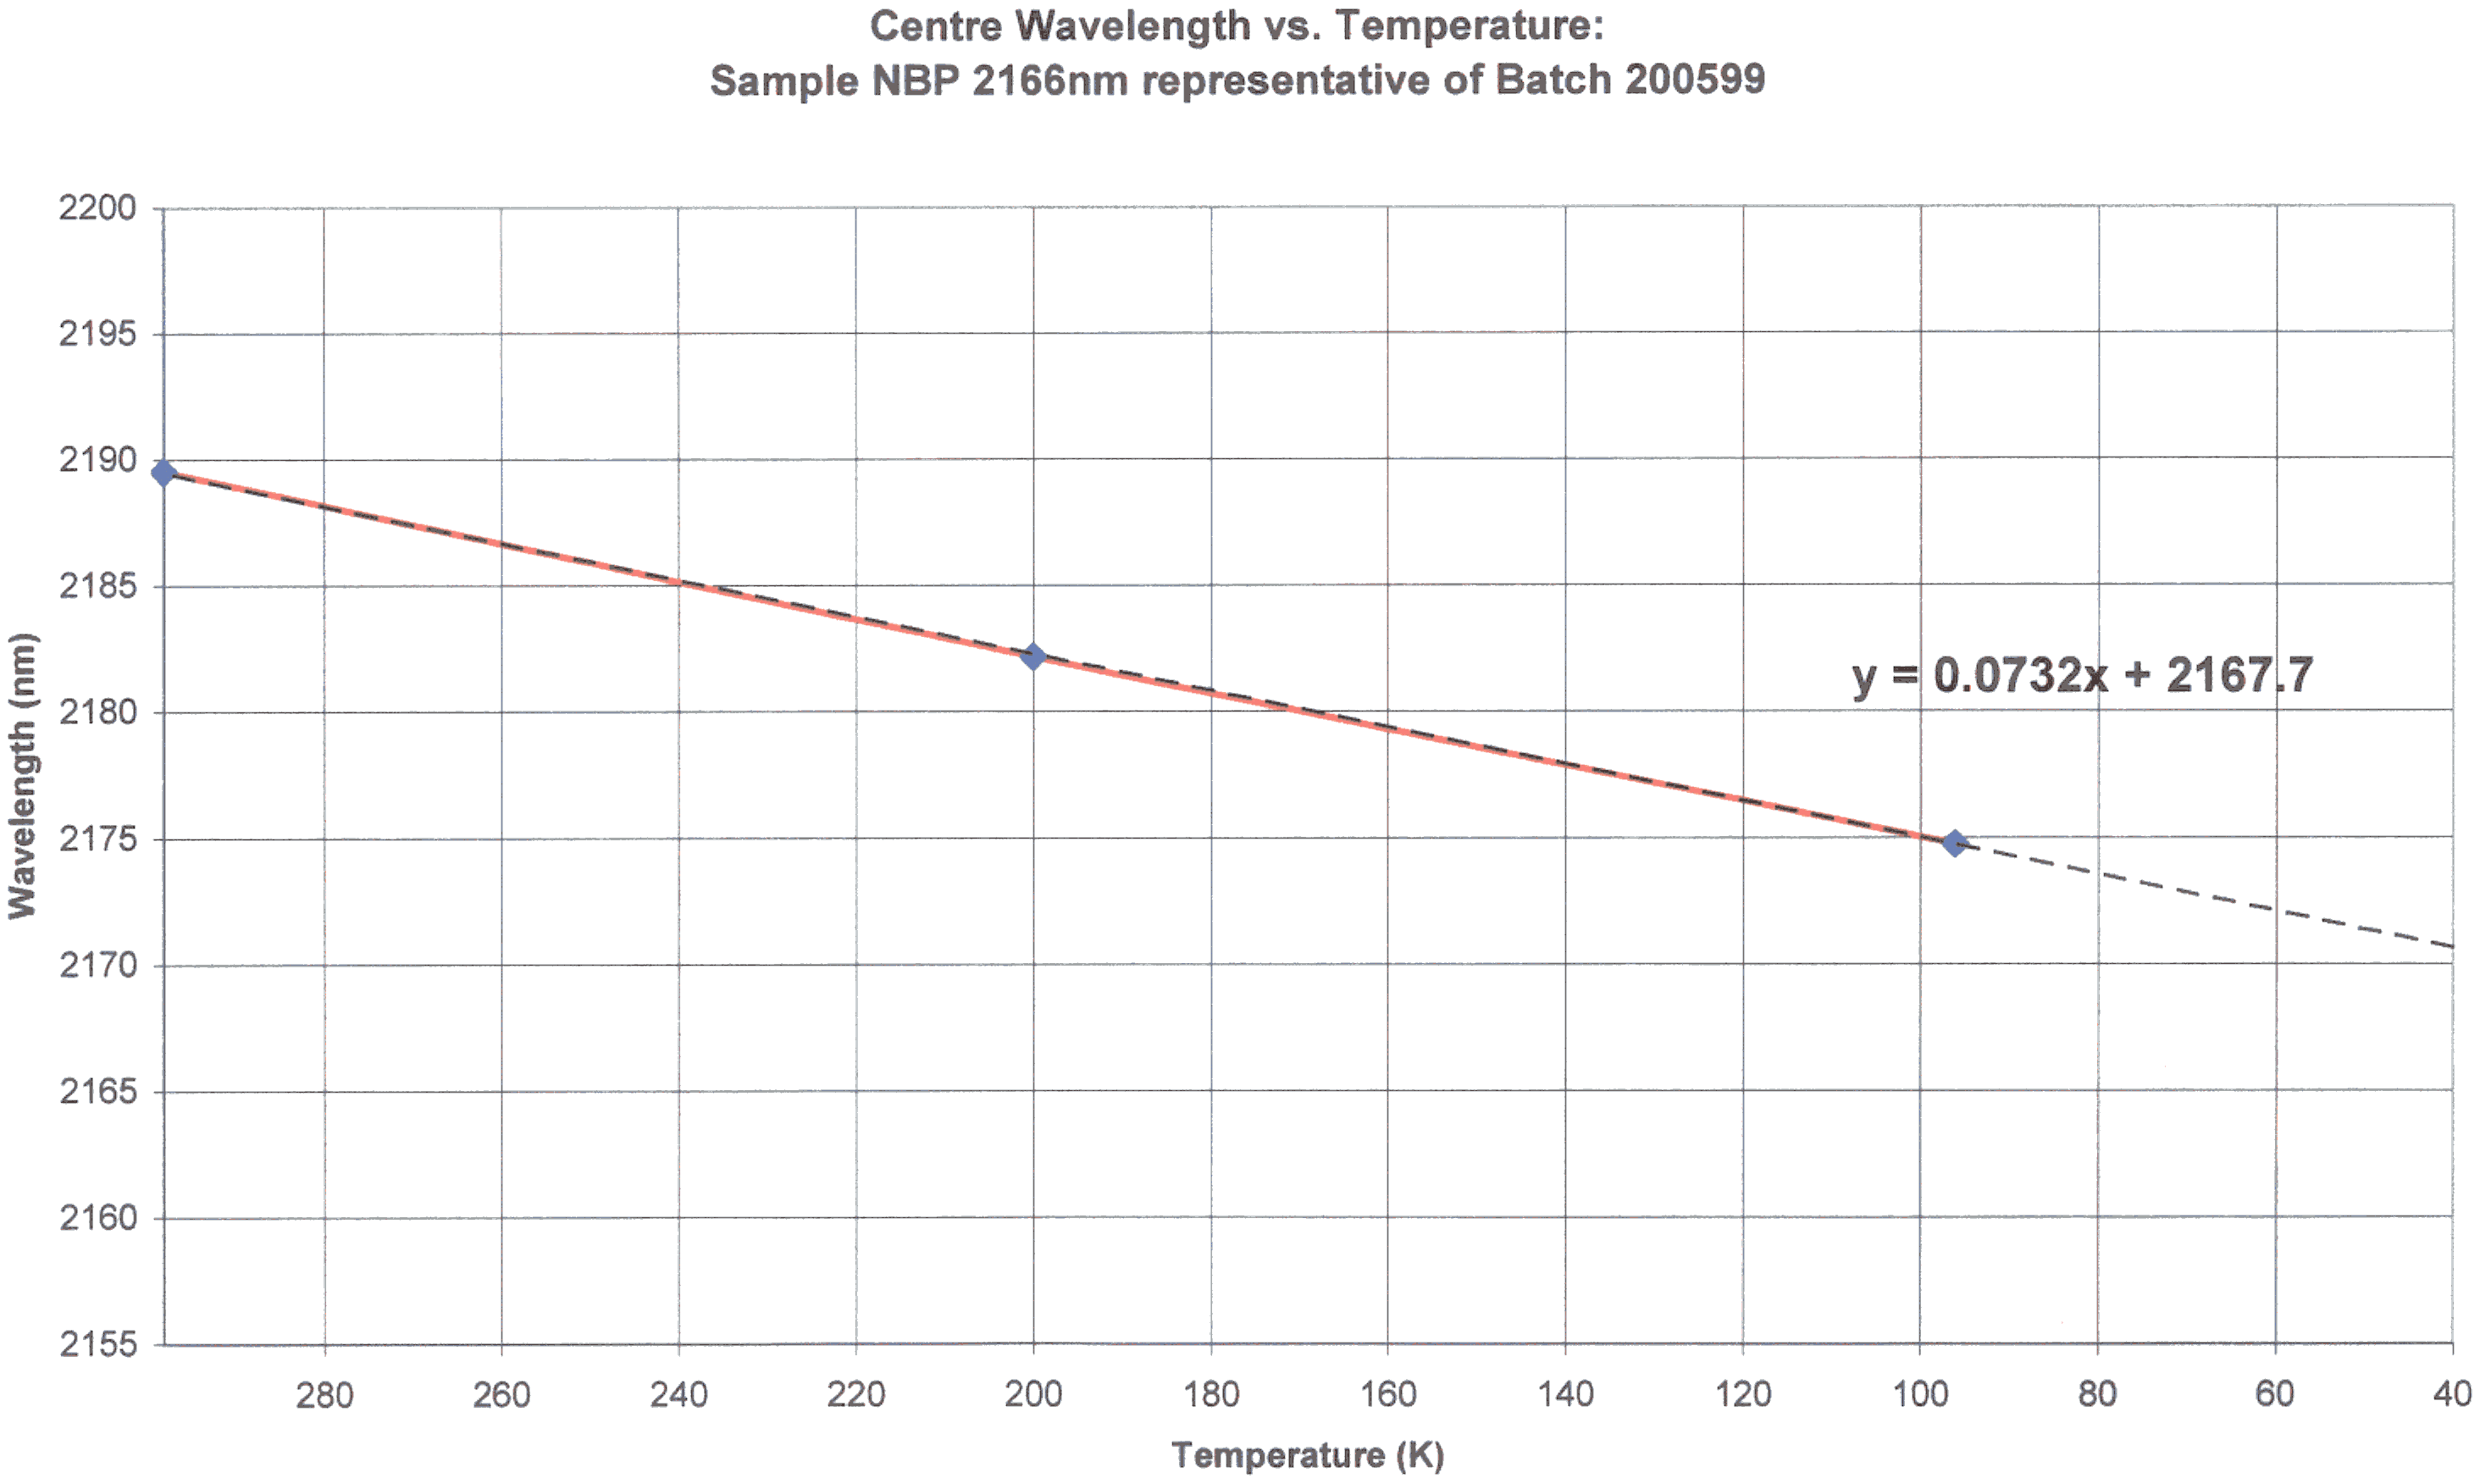
| Br-Gamma | Br-Gamma Zoomed Graph | Br-Gamma Original | Br-Gamma Temp & Tilt | NDC |
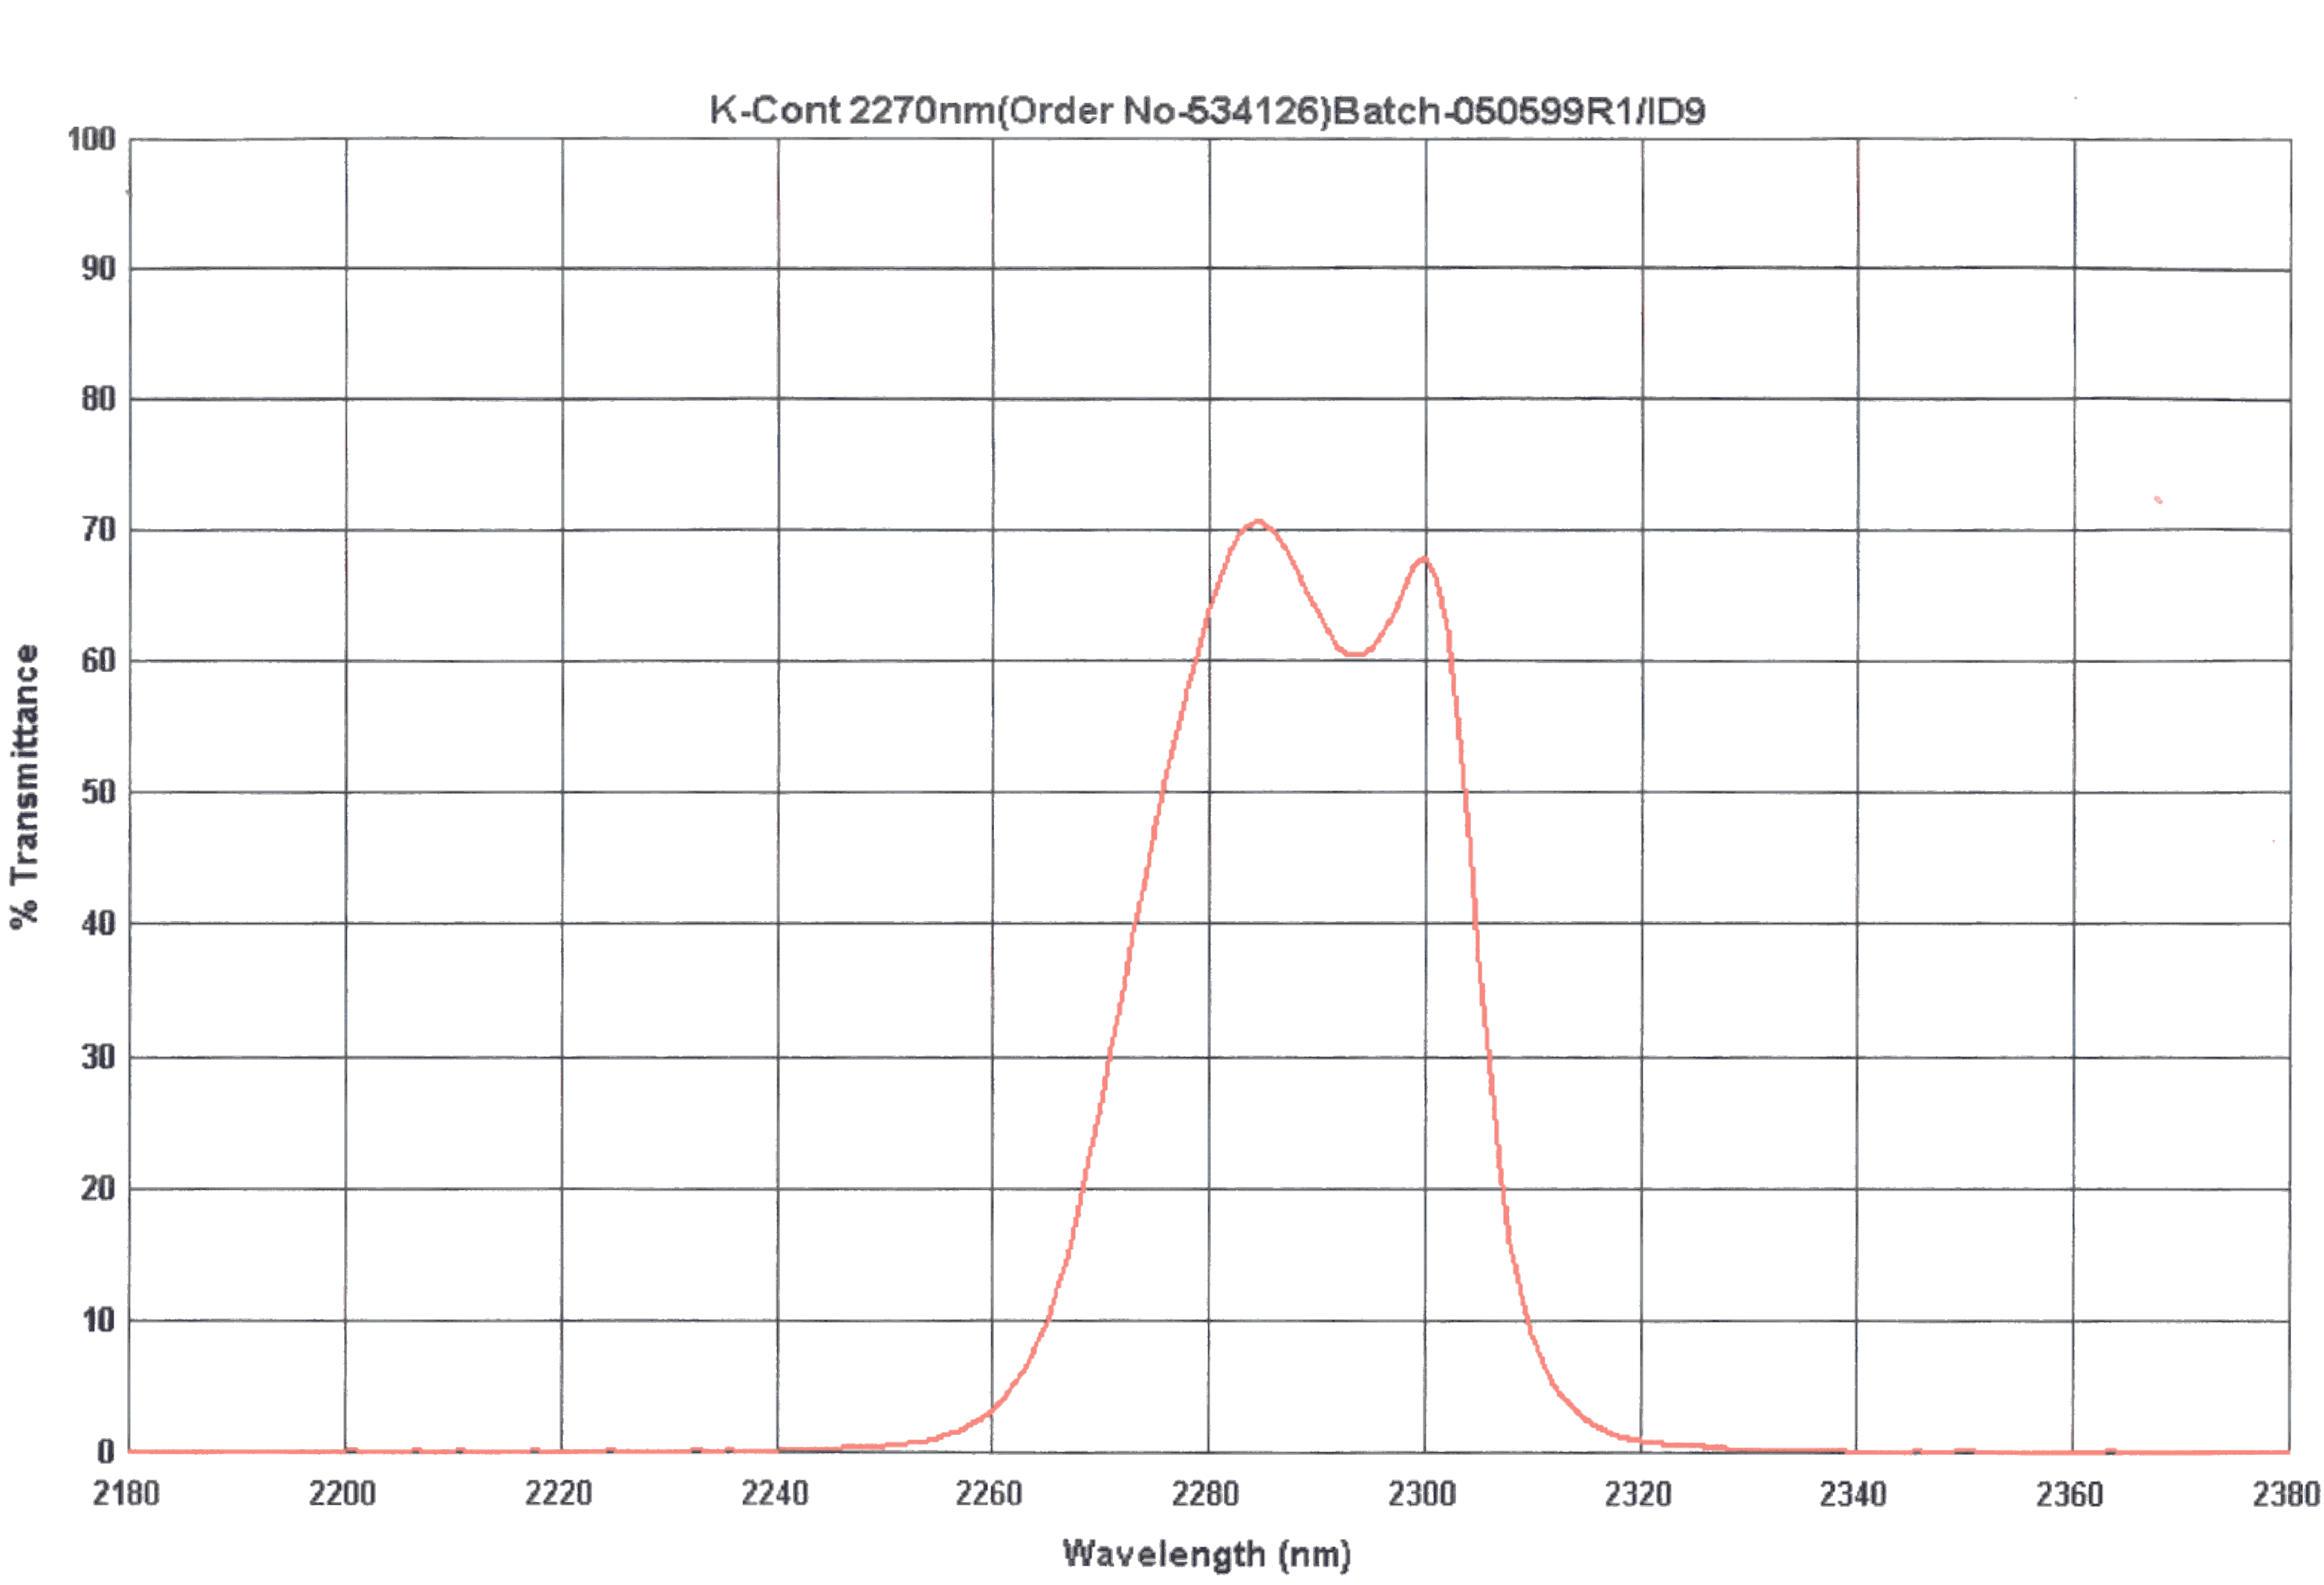
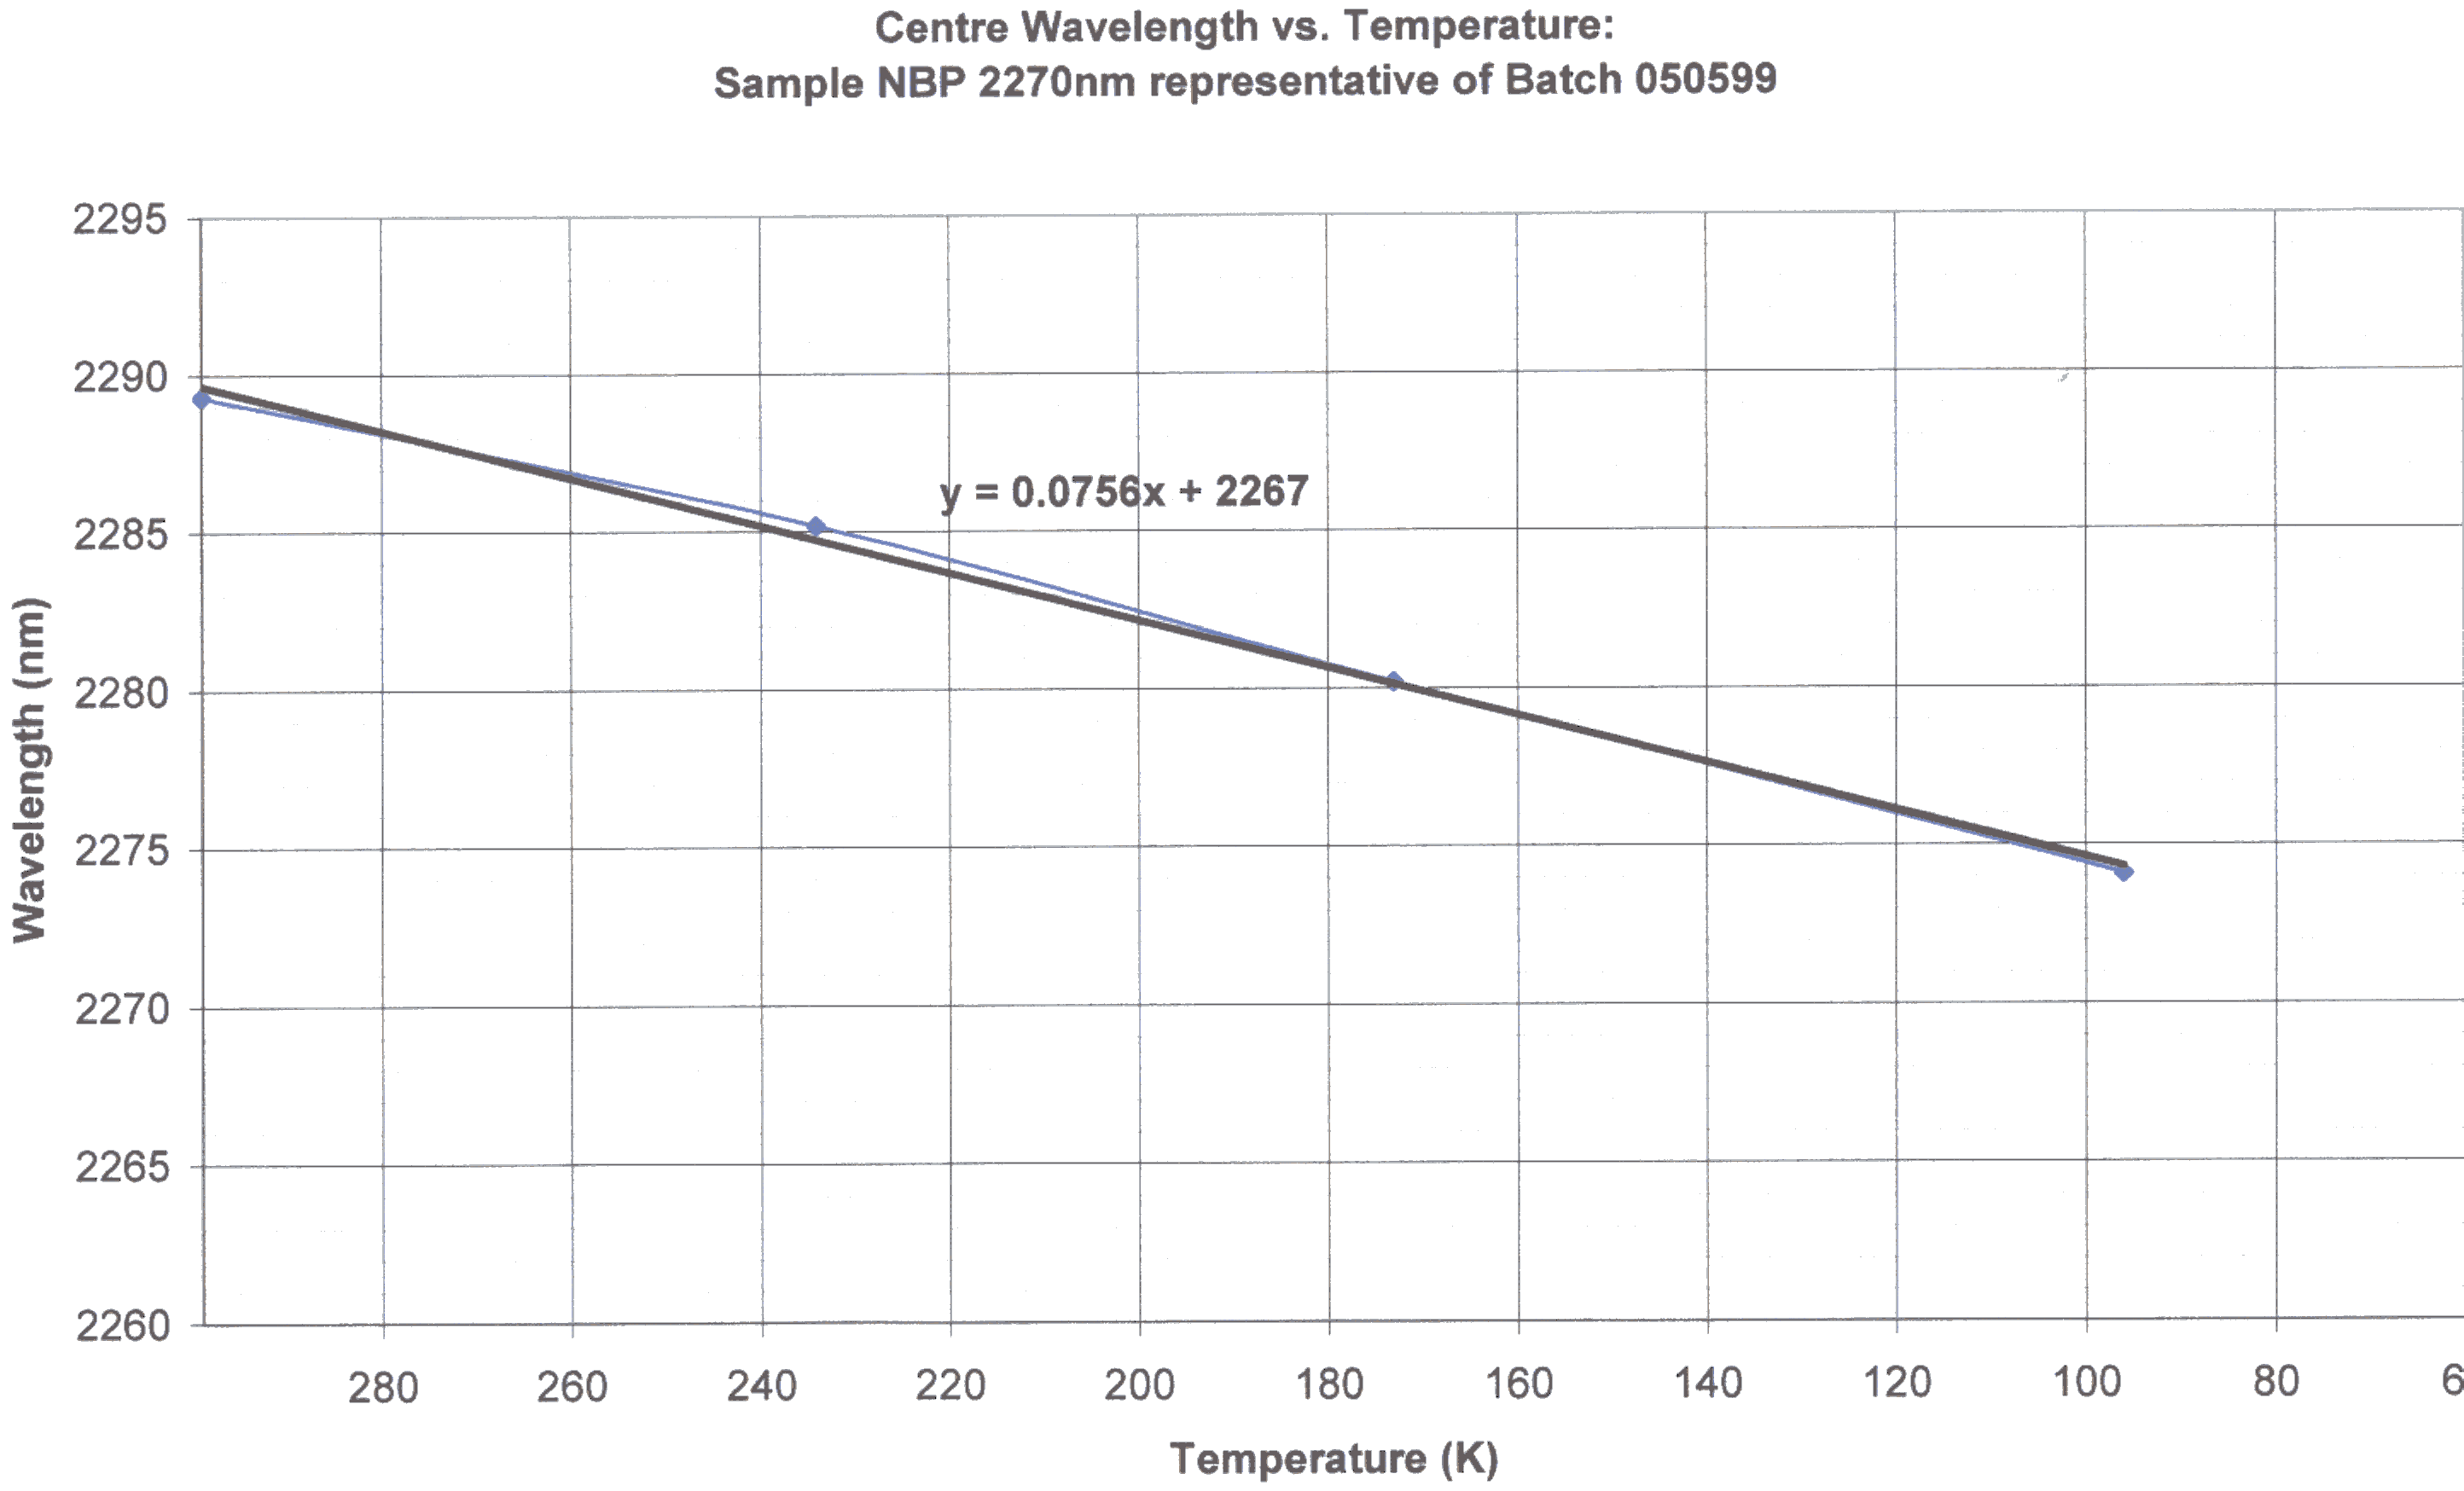
| K-Cont | K-Cont Zoomed Graph | K-Cont Original | K-Cont Temp & Tilt | NDC |
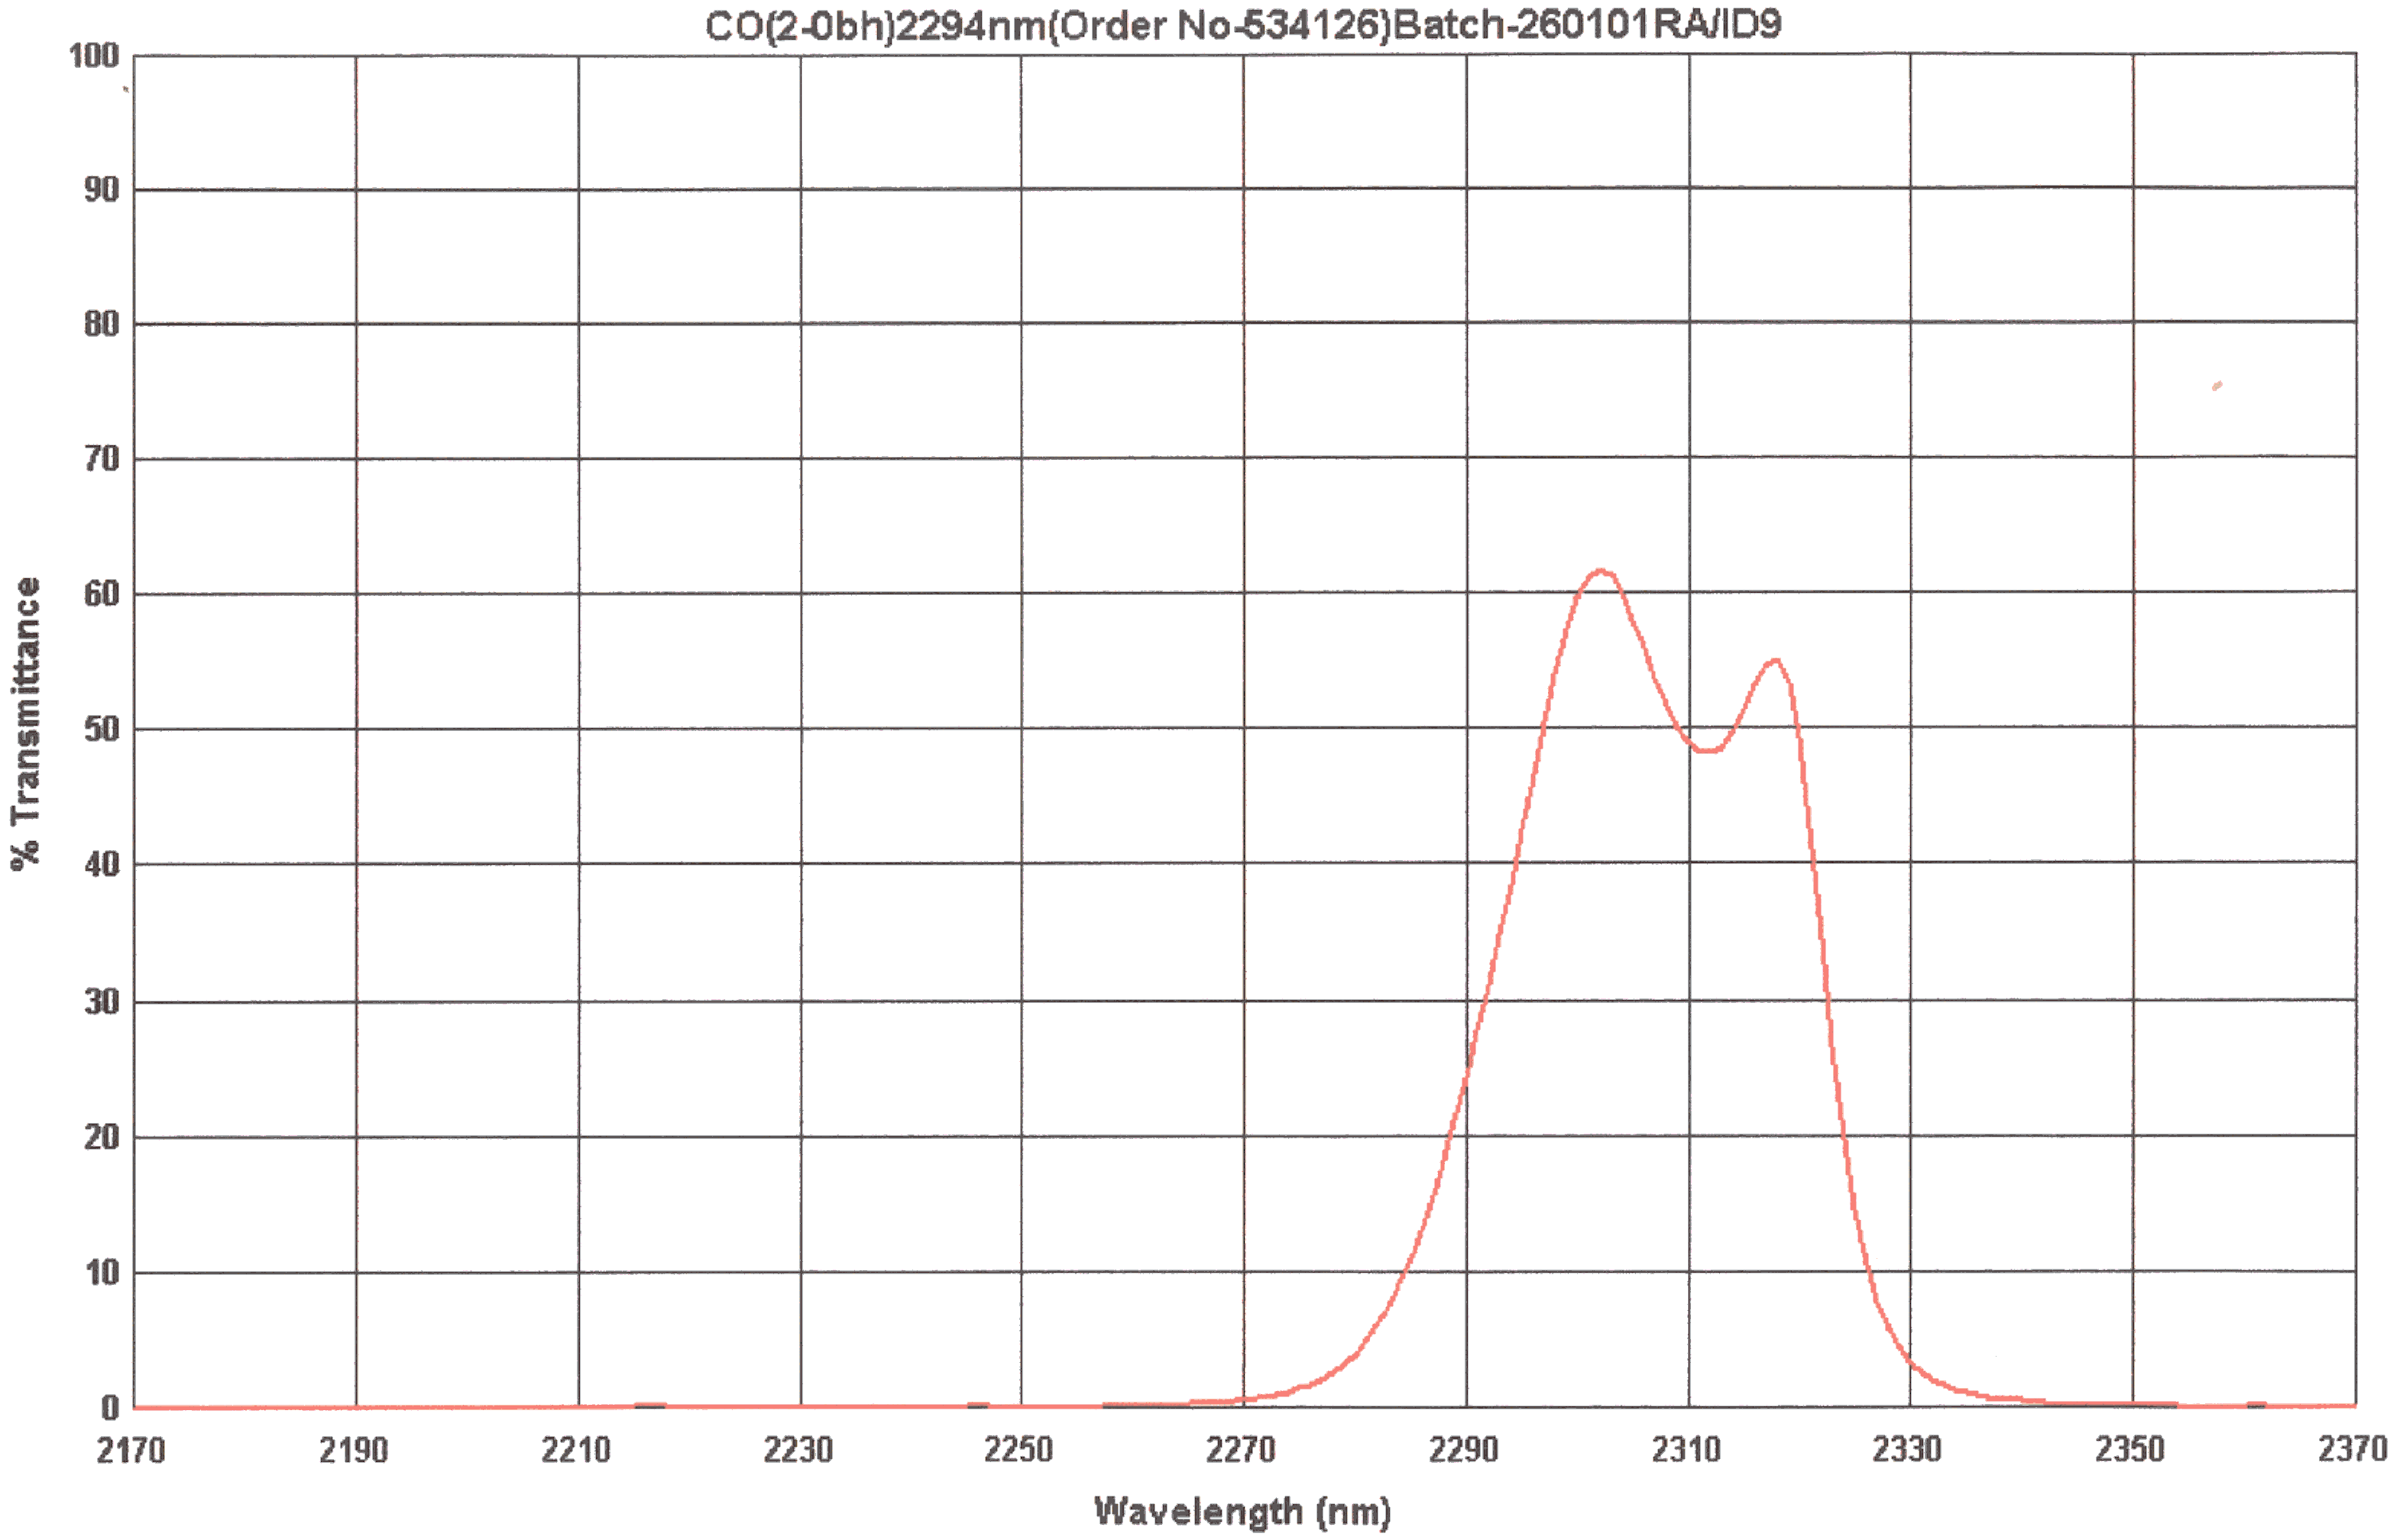
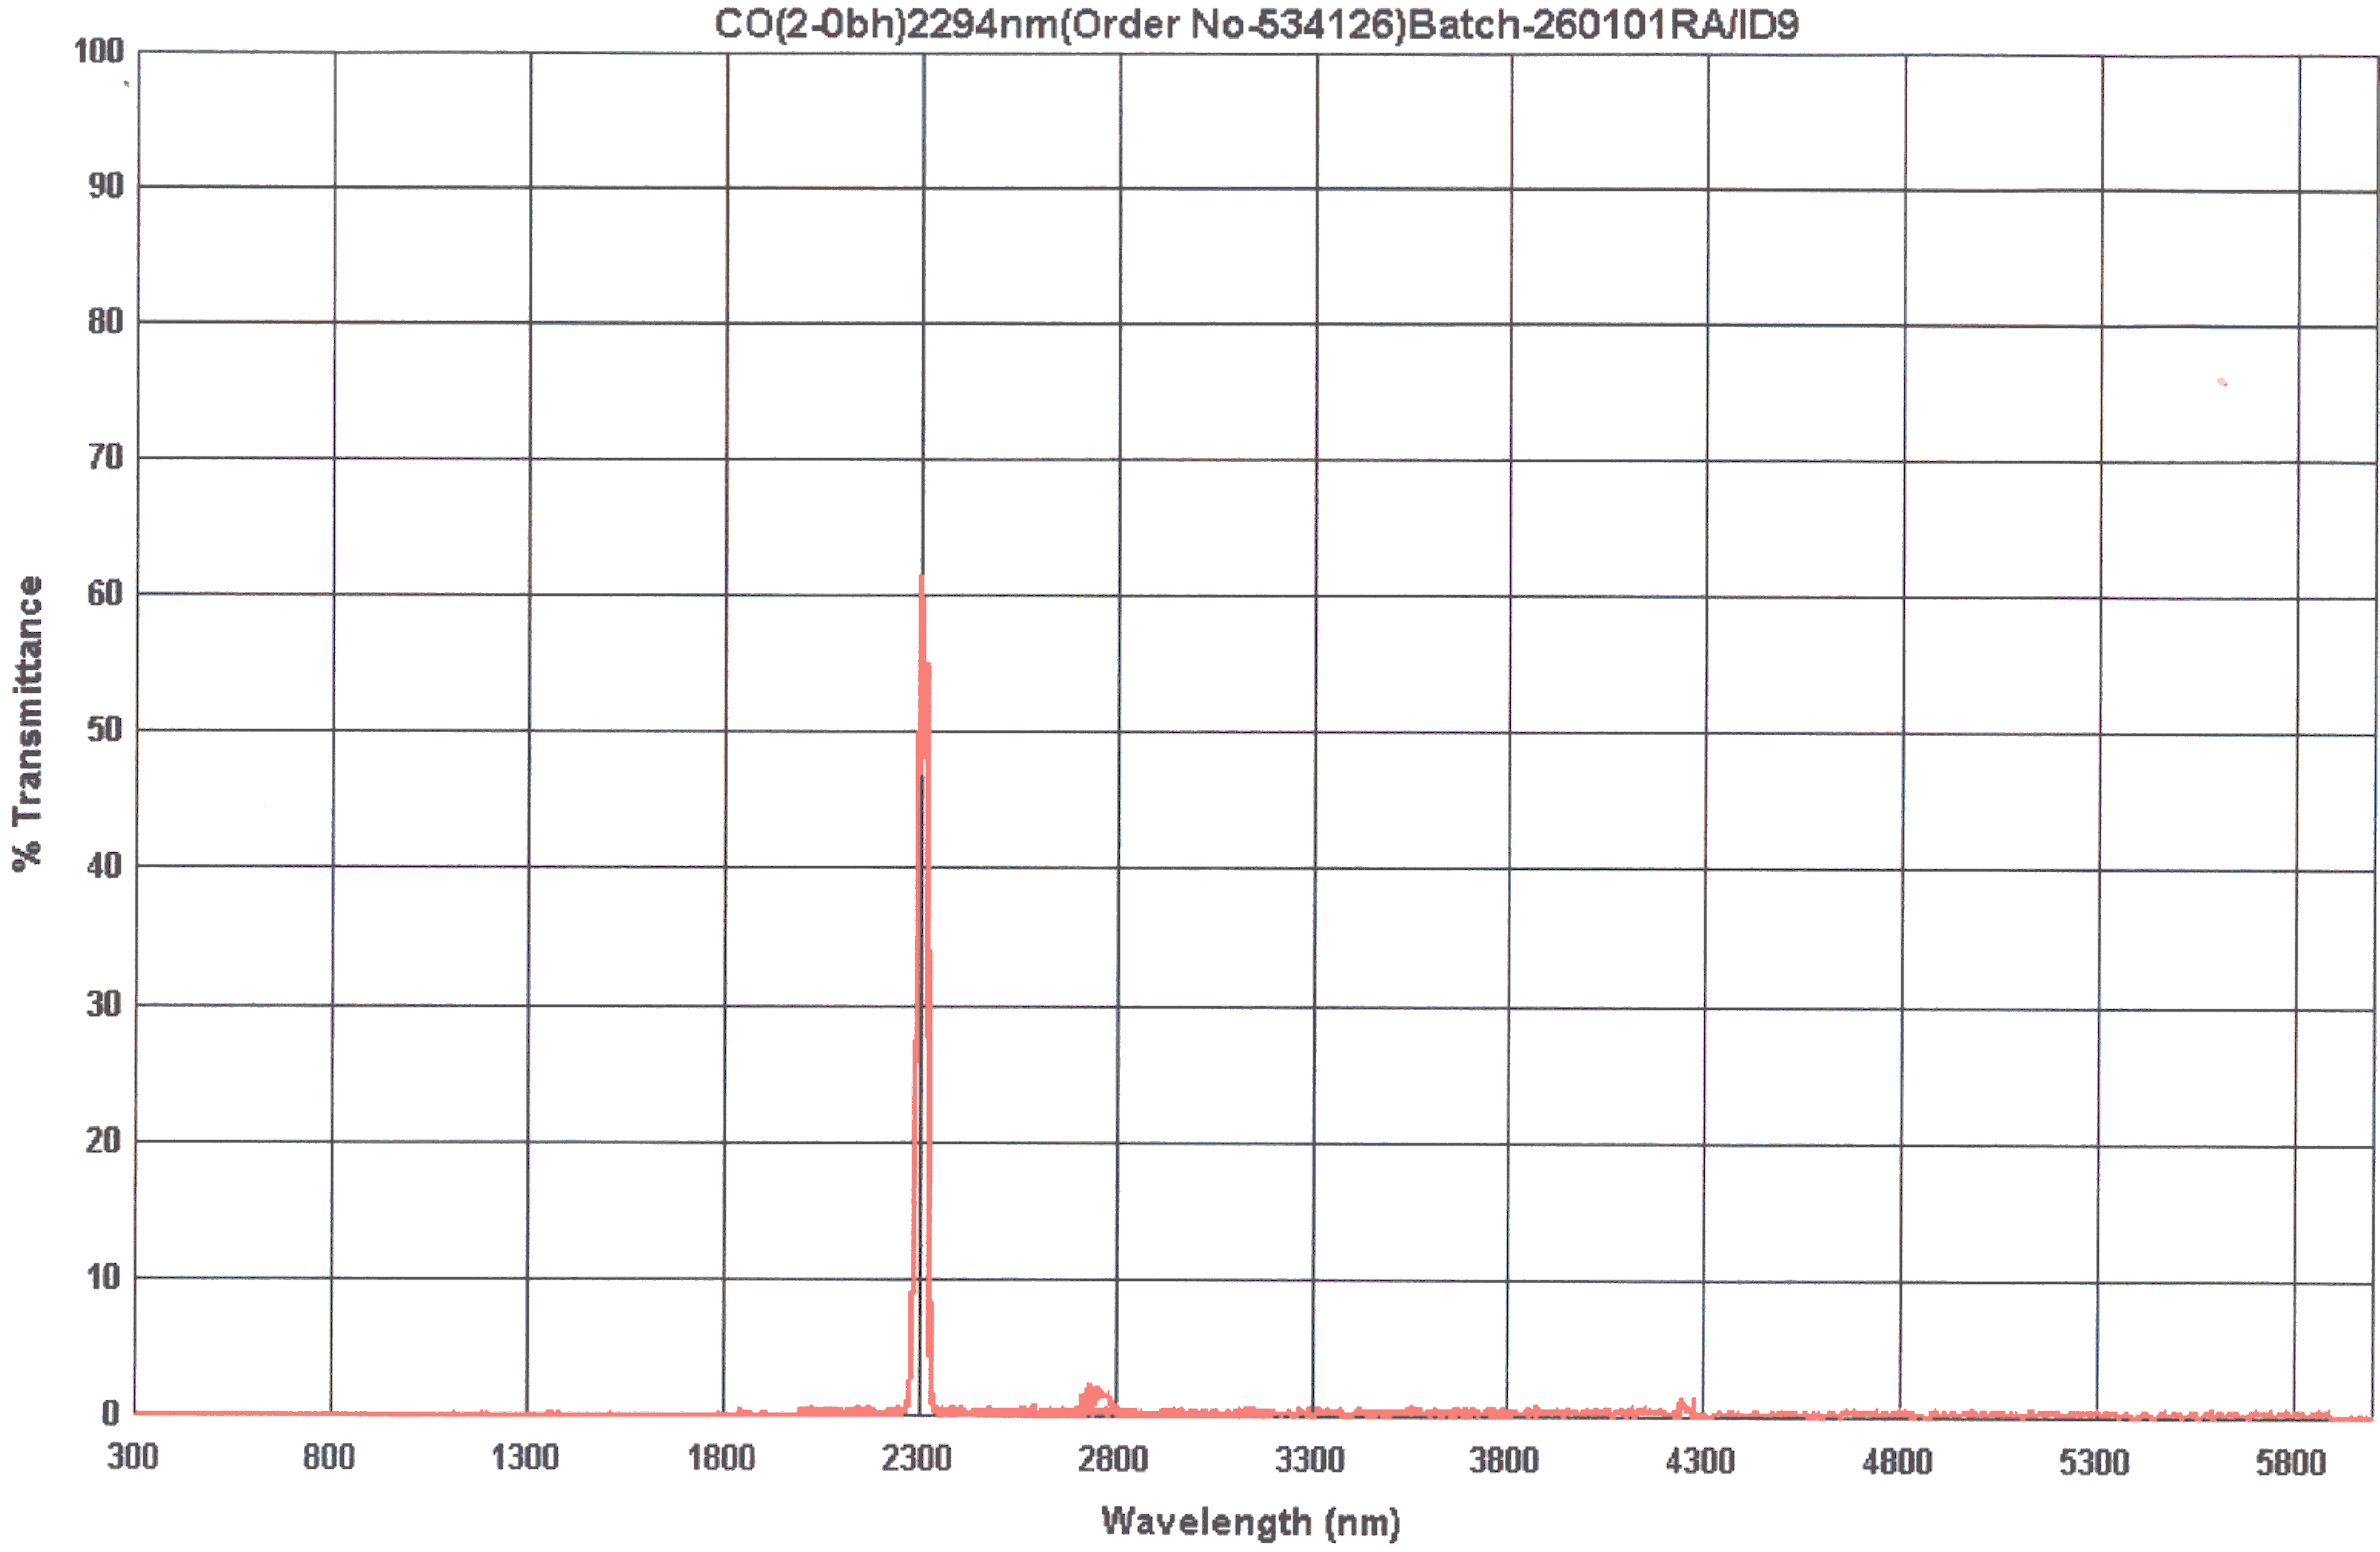
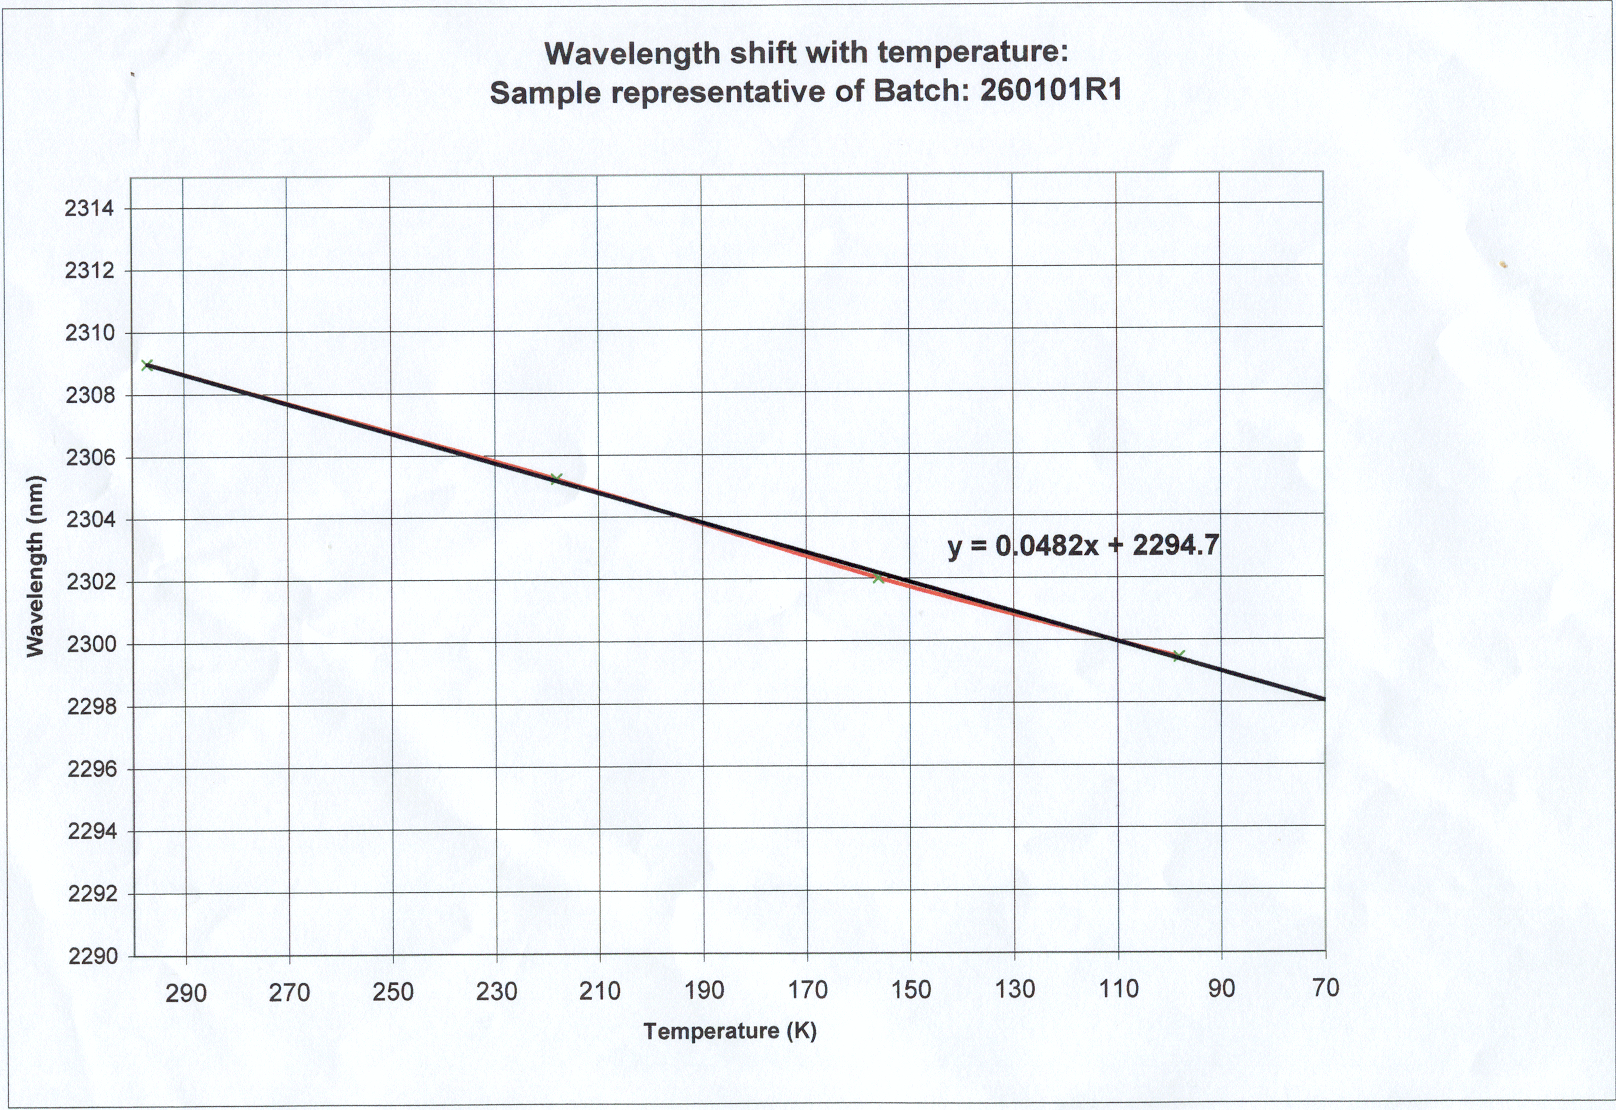
| CO(2-O BH) | CO(2-O BH) Zoomed Graph | CO(2-O BH) Original | CO(2-O BH) Temp & Tilt | NDC |
Methane Filters
| Filter | Scanned Zoomed Profile | Original Data | Tilt Corrected Data | Temperature Shift | Manufacturer | Note |
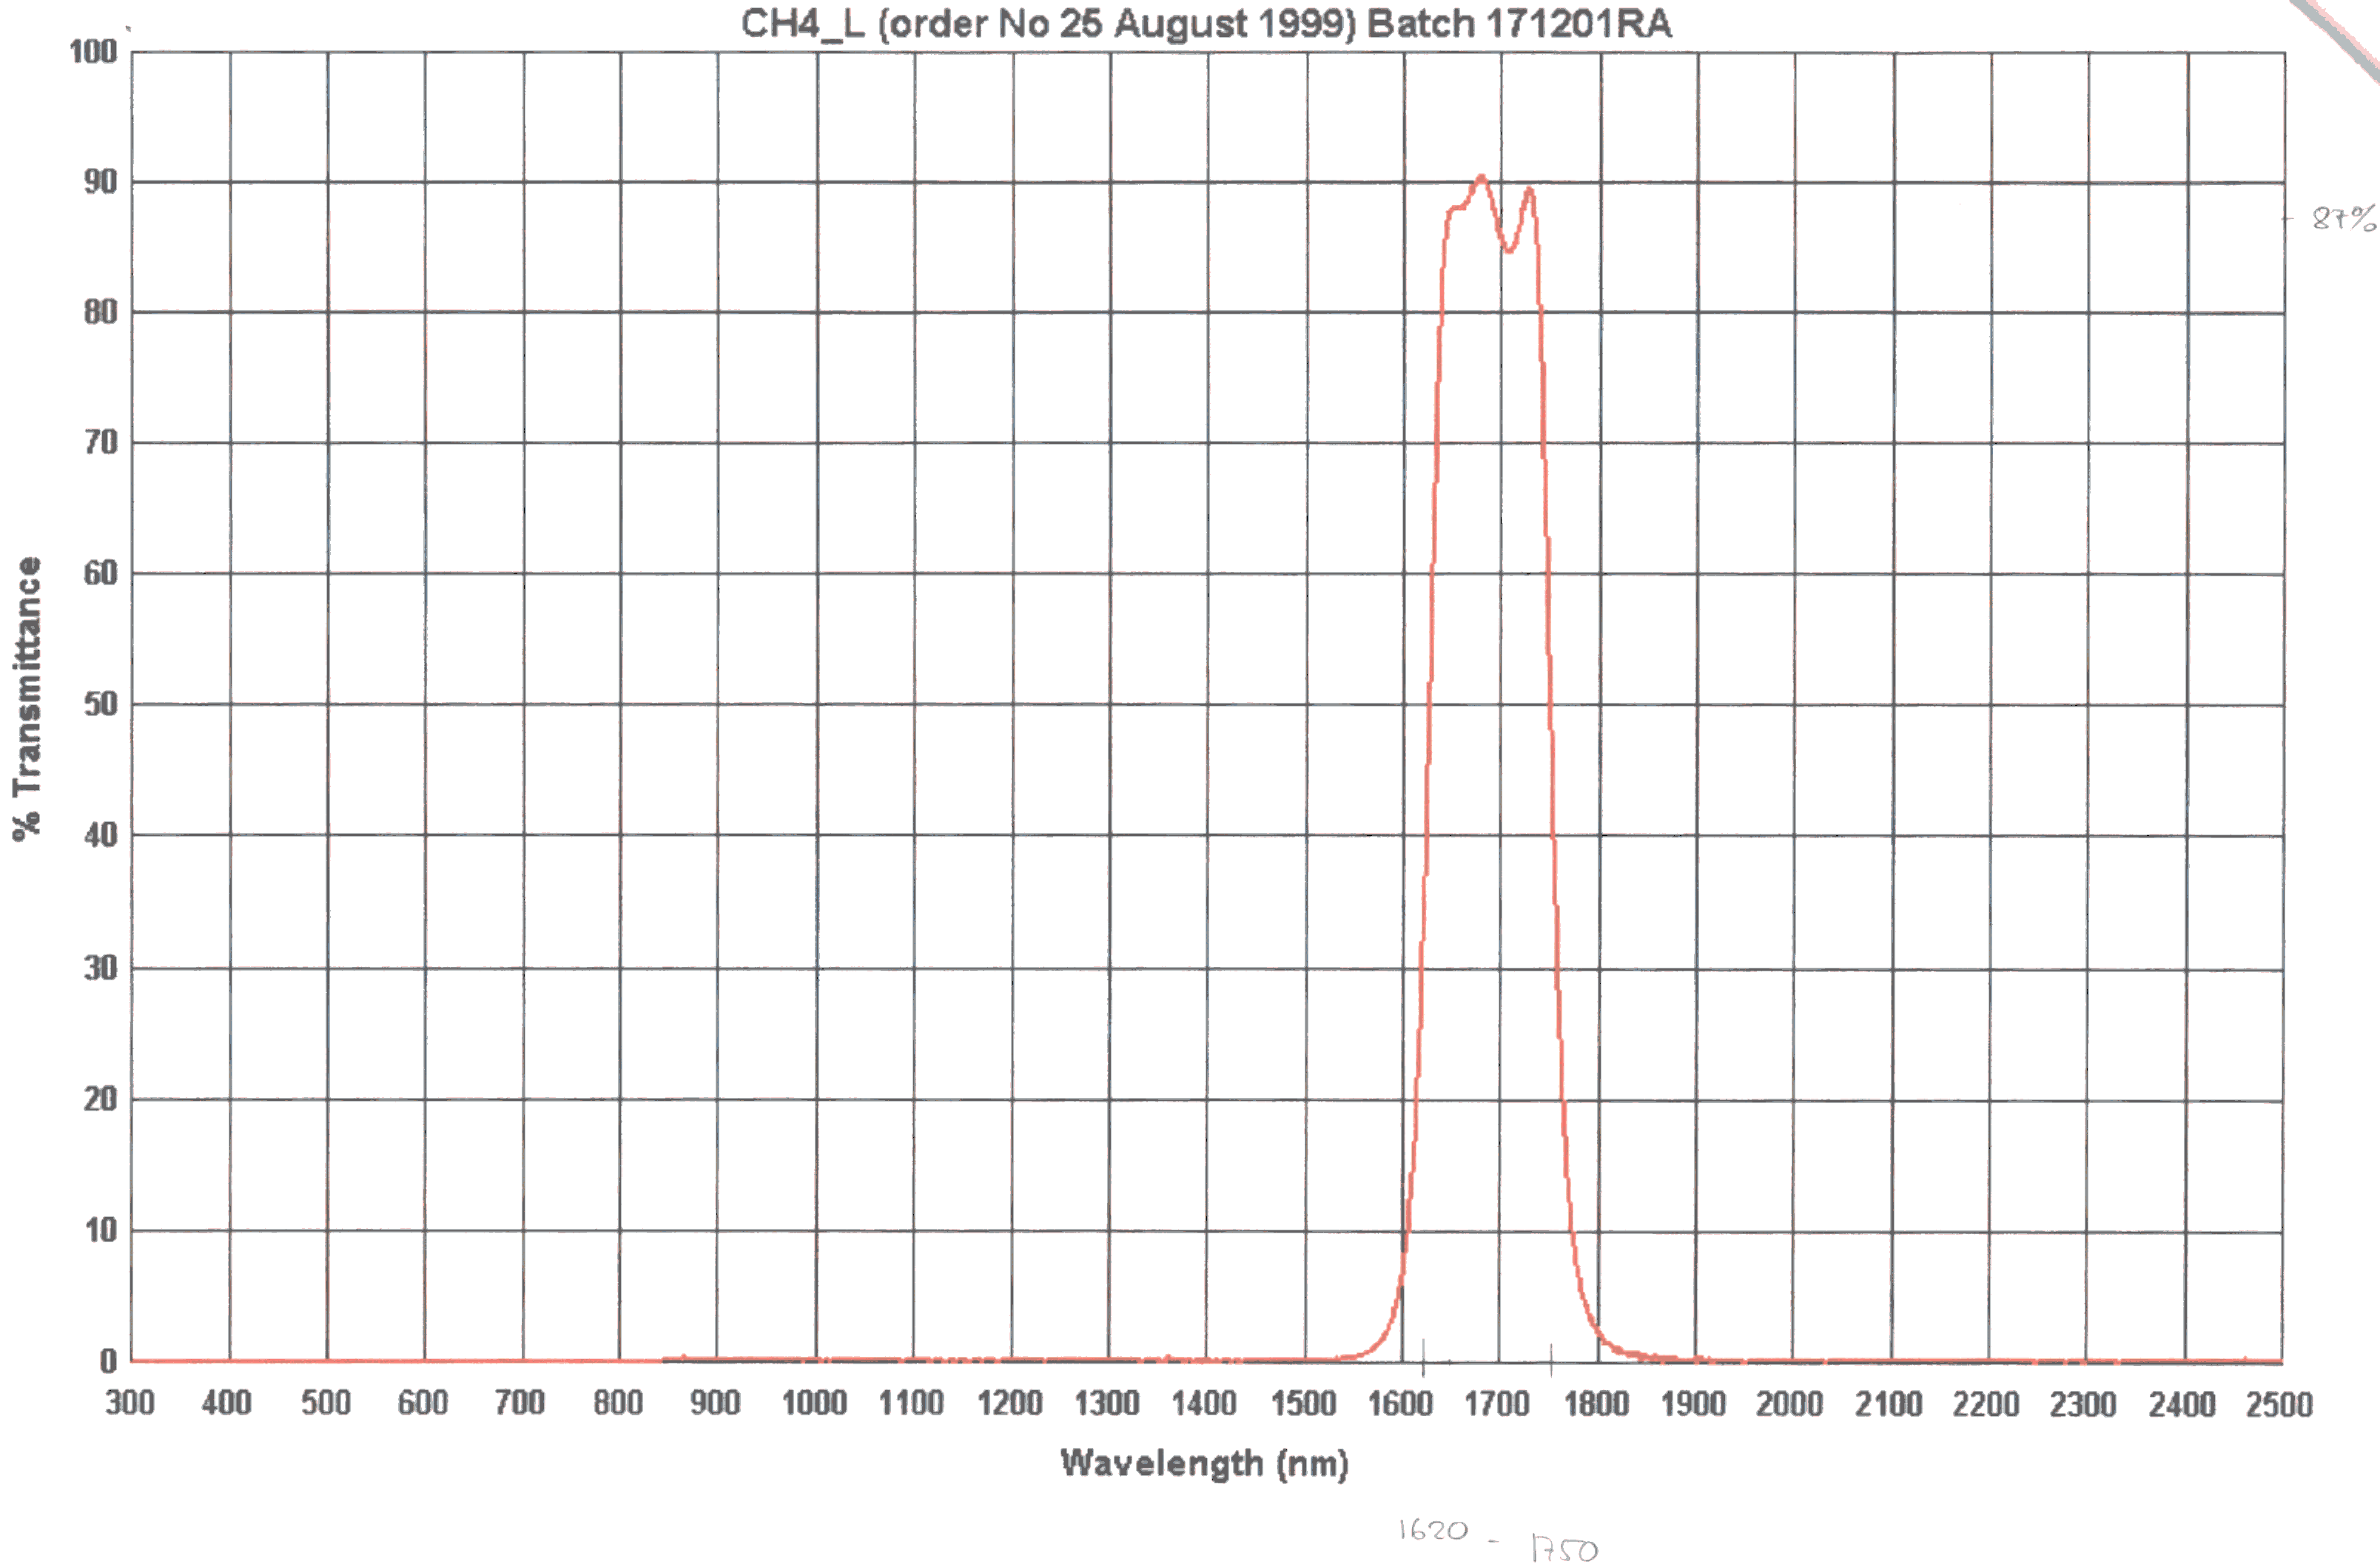
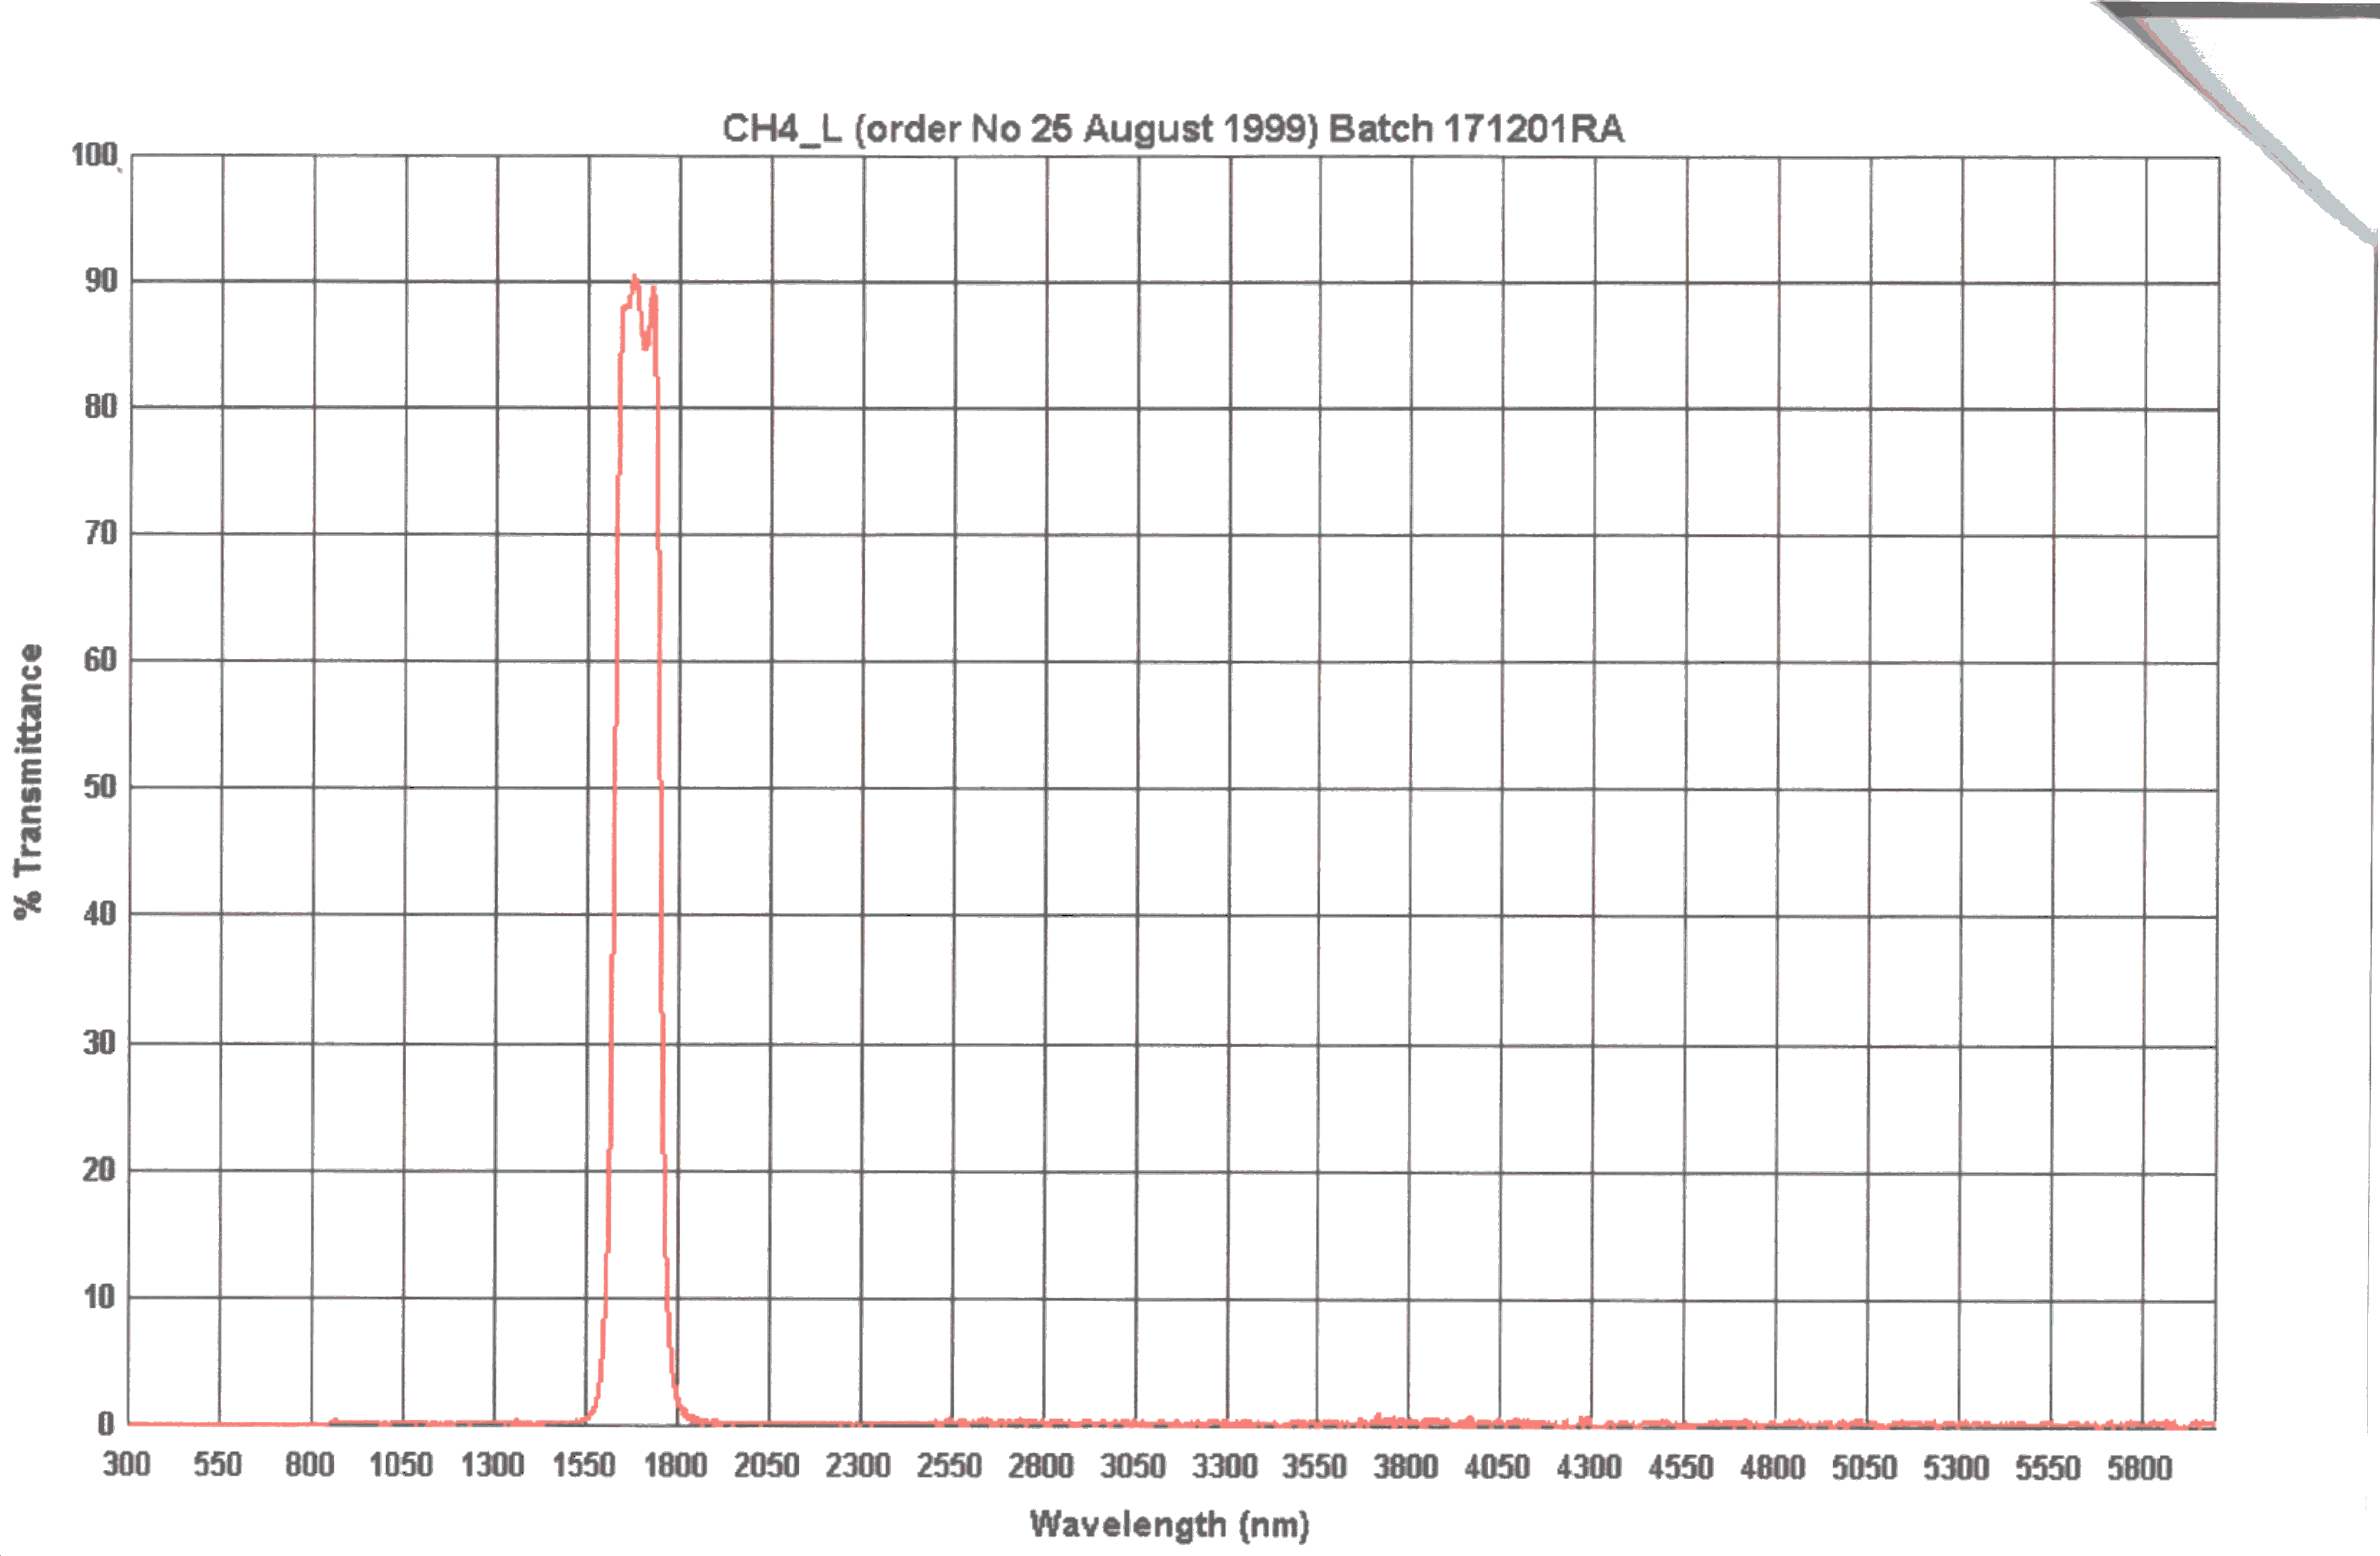
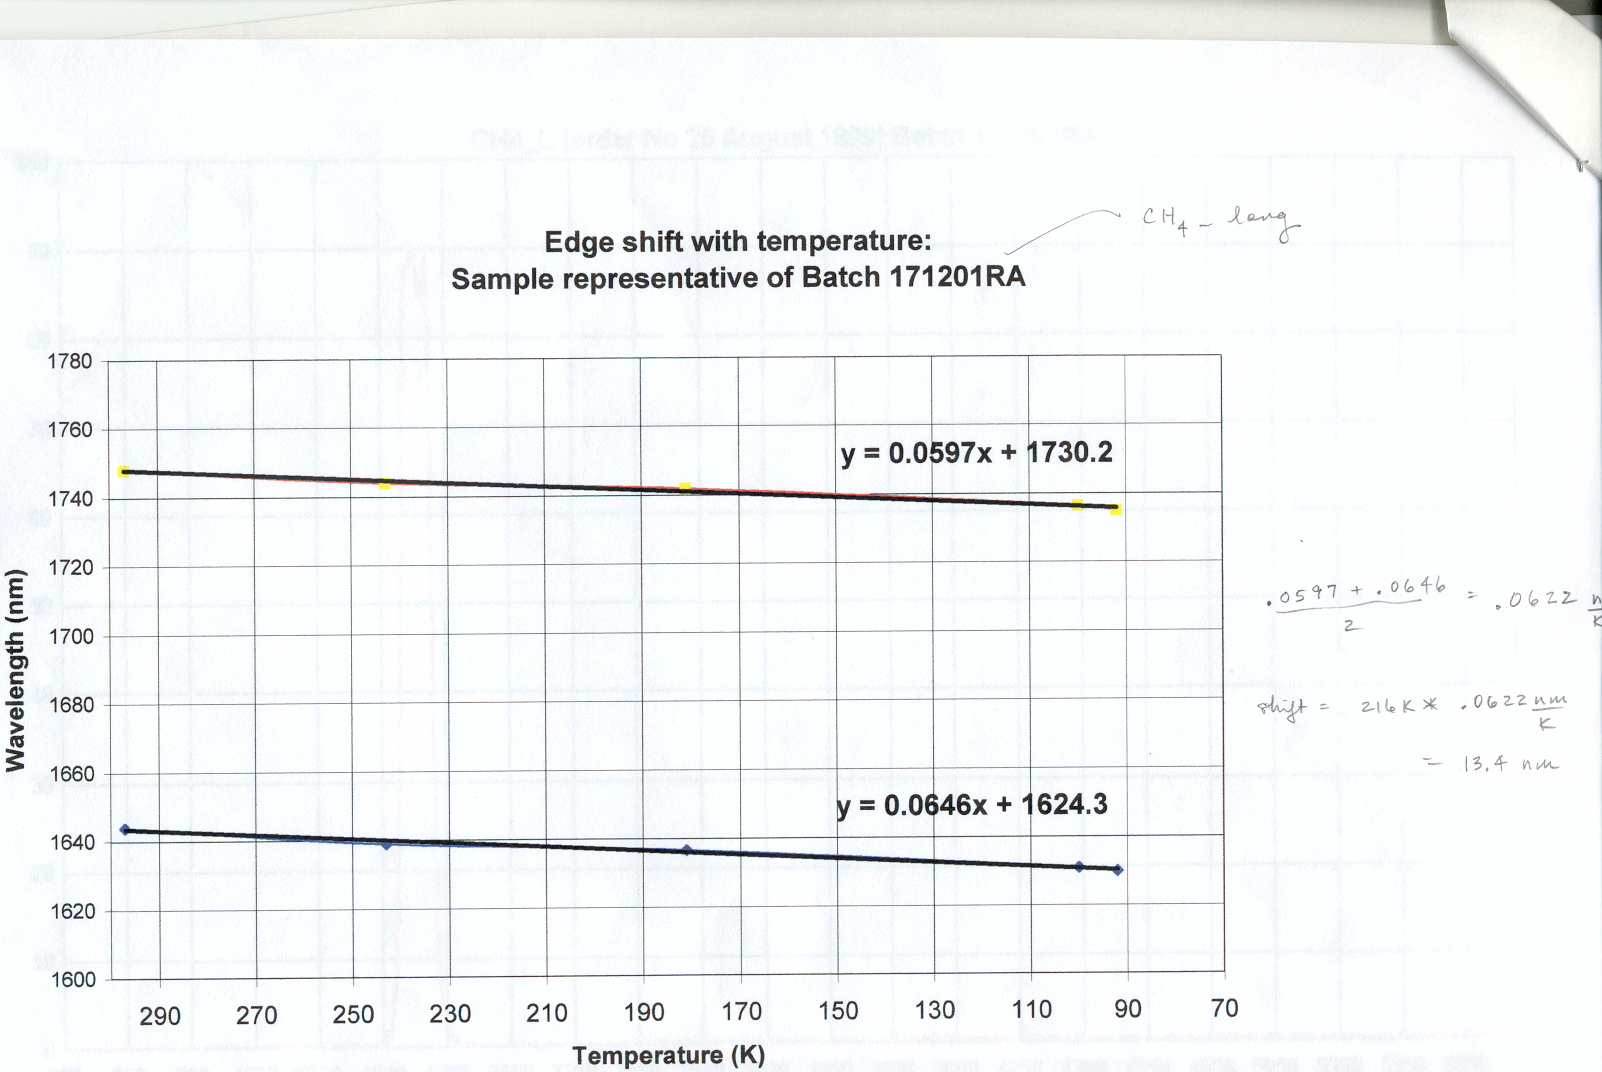
| CH4_L |
CH4 L Zoomed Graph |
CH4 L Original |
CH4 L Tilt |
cut-on: - 13.9536 nm cut-off: - 12.8952 nm |
NDC |
6 |
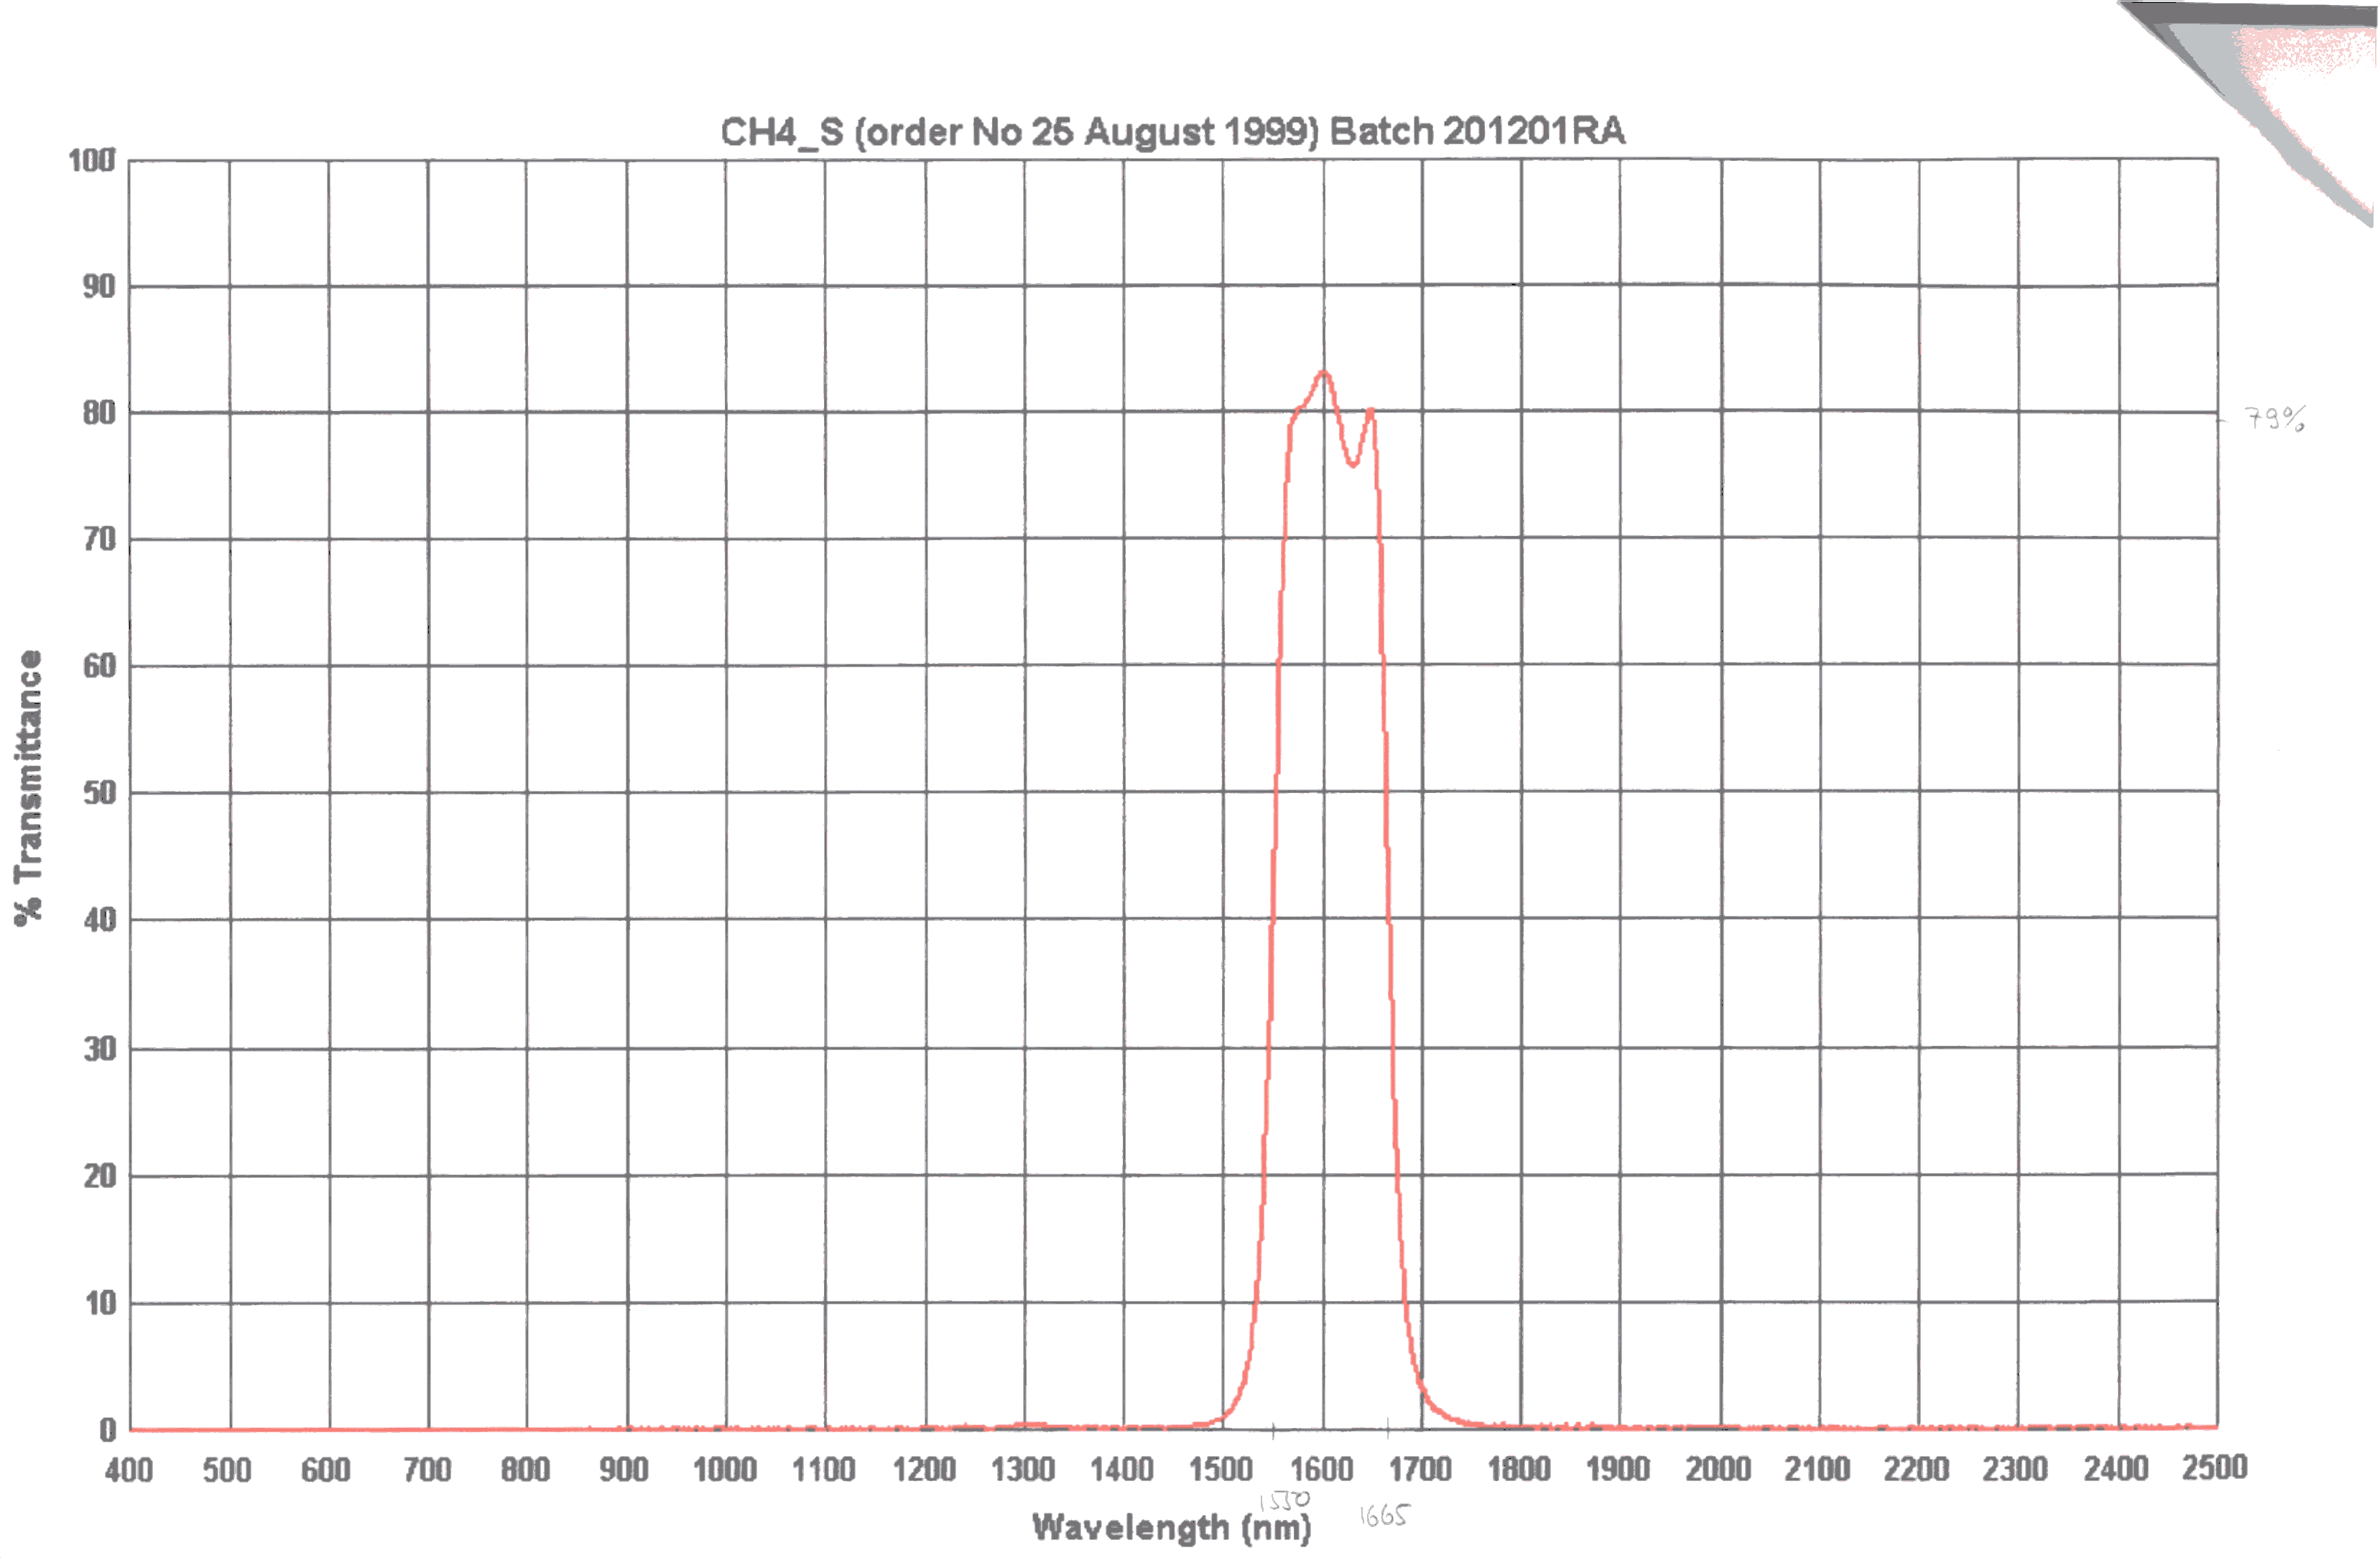
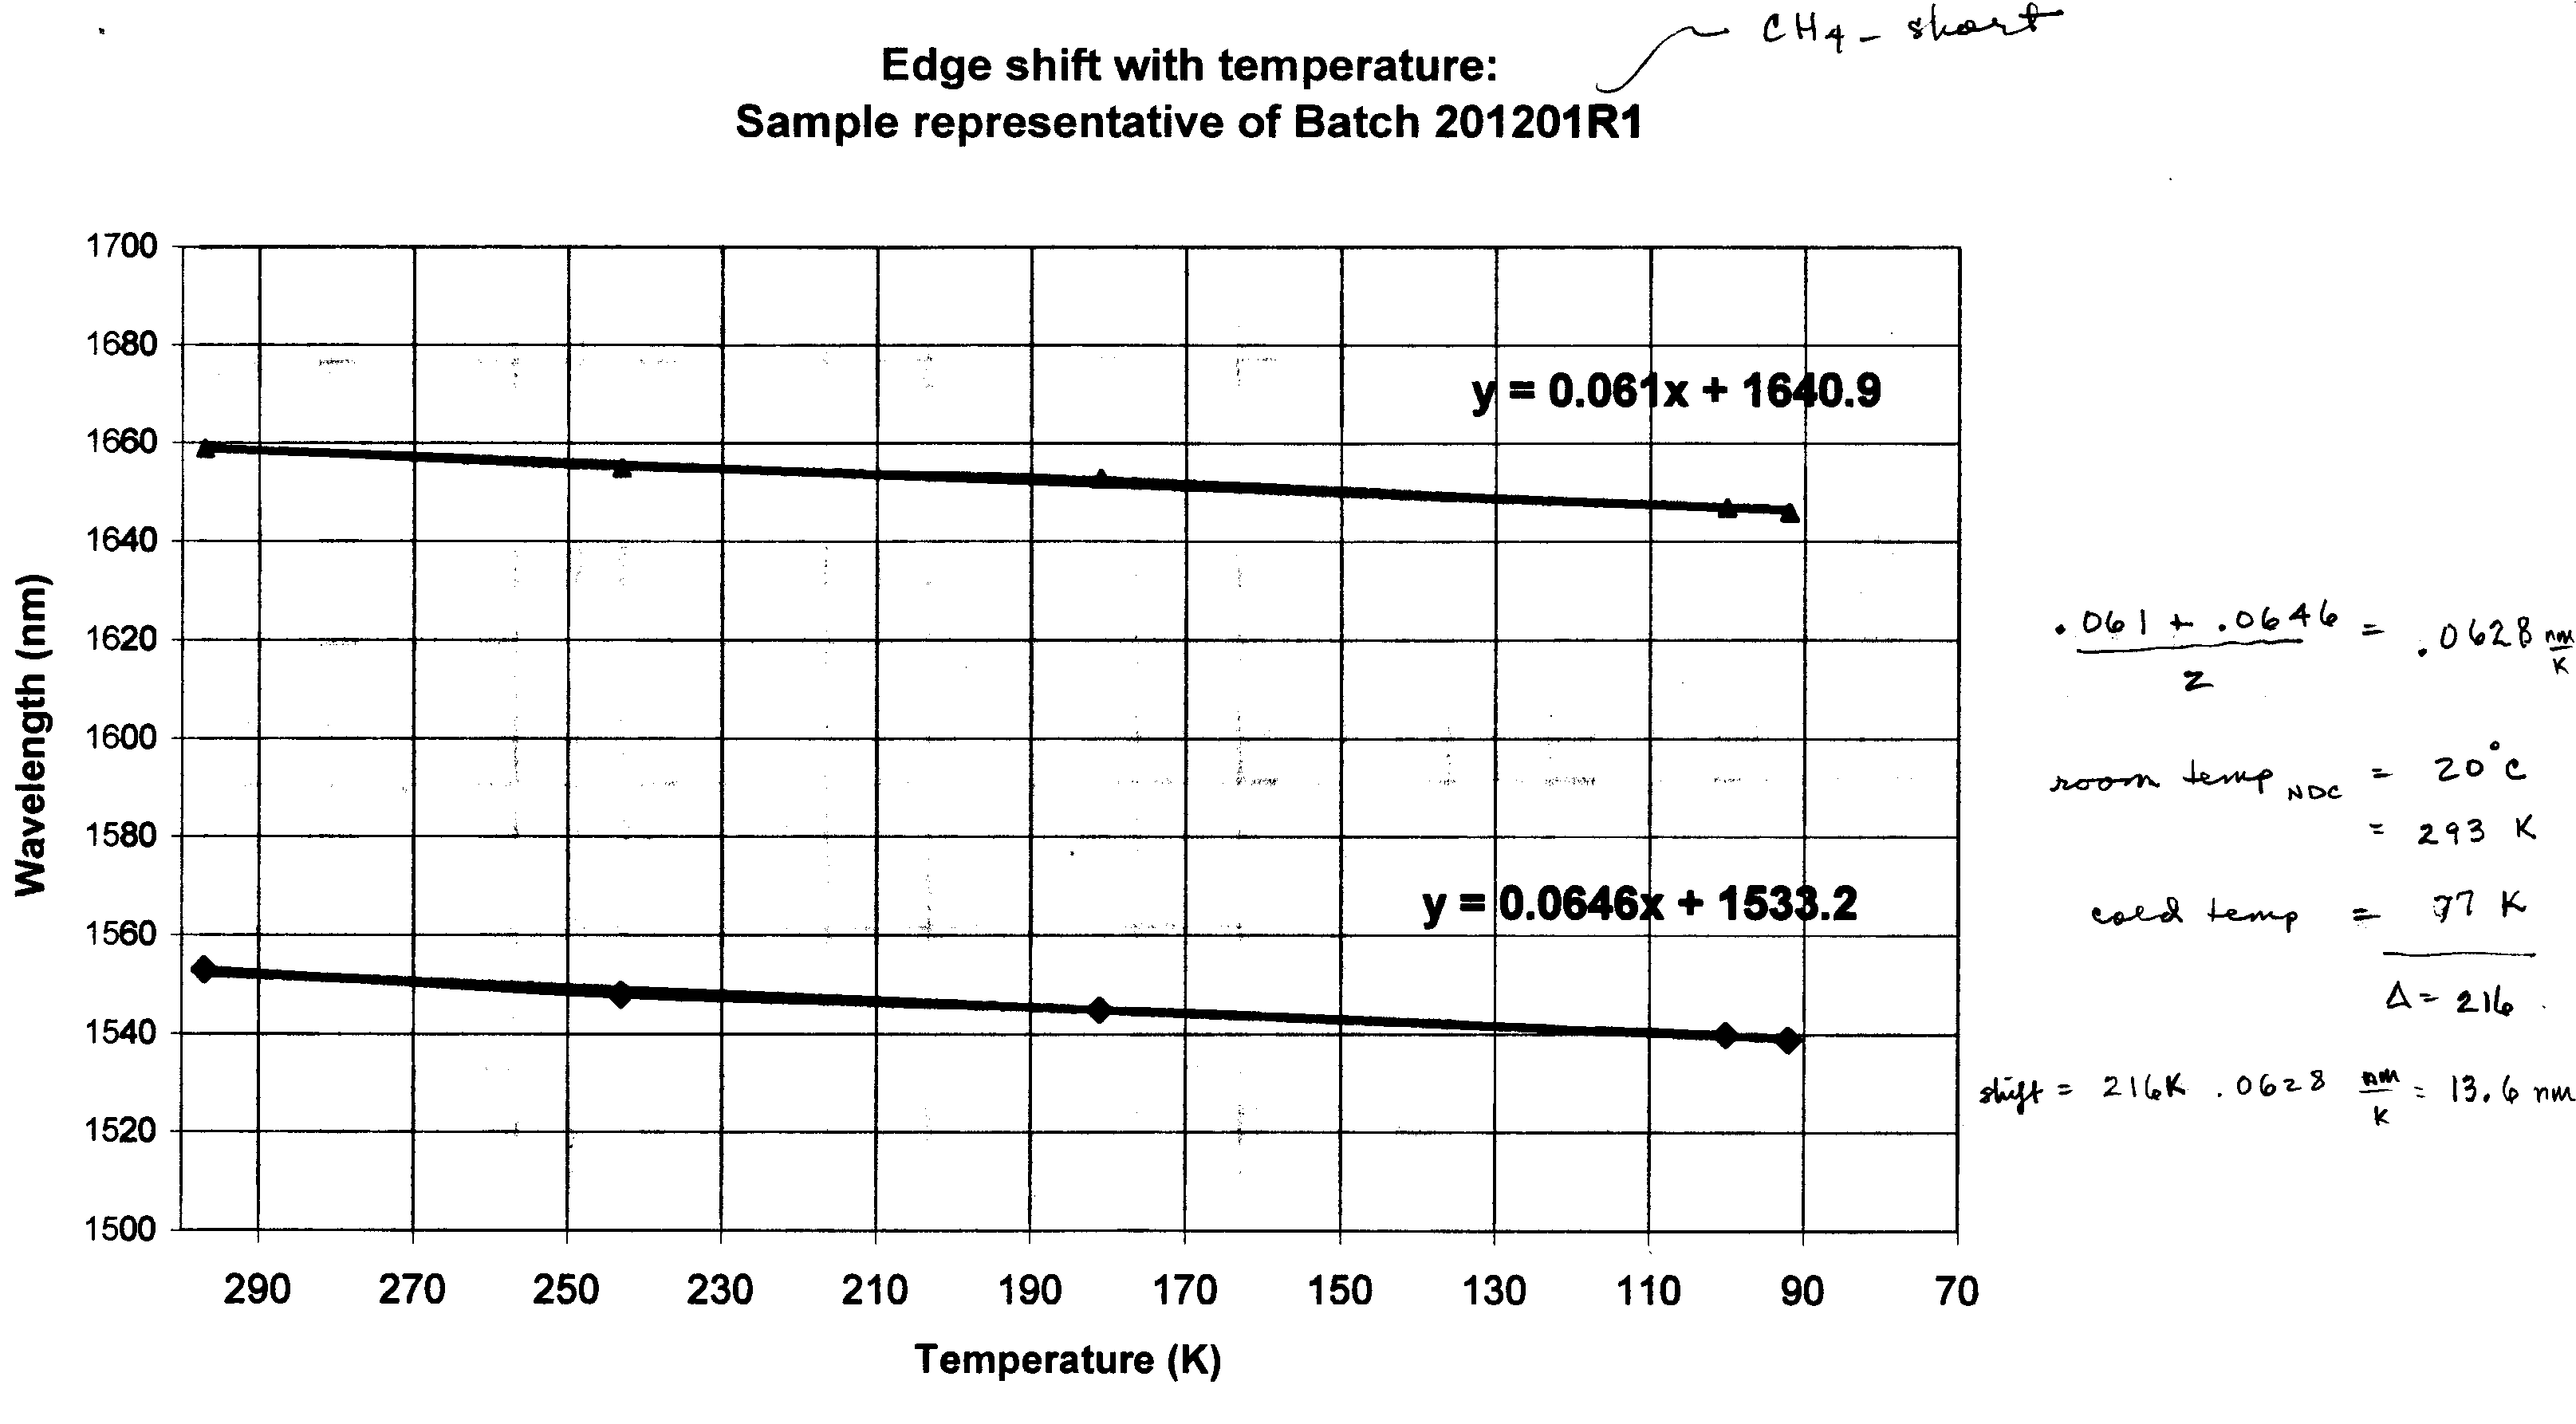
| CH4_S |
CH4 S Zoomed Graph |
CH4 S Original |
CH4 S Tilt |
cut-on: - 13.9536 nm cut-off: - 13.176 nm |
NDC |
6 |
(1) The following values are taken from the side of
the filter boxes. Although they do not match the scanned data, the graphs are
representative of standard H and K transmission.
J
Filter
H
Filter
SO
14-8744-460
14-8744-460
PO
393 745
393 745
RN
1011-534Z/541Z
563-606/607
SN
33
41
LOT
4Z
7
More Scanned Data
Plots from NDC
Percent Transmittence vs. Wavelength(nm)
| Filter | Full Continuum Profile | Temp Shift w/Temp |
| J-Cont | J-Cont Full Graph | J-Cont Graph |
| Pa-Beta | Pa-Beta Full Graph | Pa-Beta Graph |
| H-Cont | H-Cont Full Graph | H-Cont Graph |
| Fe-II | Fe-II Full Graph | Fe-II Graph |
| Br-Gamma | Br-Gamma Full Graph | Br-Gamma Graph |
| K-Cont | K-Cont Full Graph | K-Cont Graph |
| CO(2-O BH) | CO(2-O BH) Full Graph | CO(2-O BH) Graph |
| CH4_L | CH4_L Full Graph | CH4_L Graph |
| CH4_S | CH4_S Full Graph | CH4_S Graph |
Created by CMH, March 15, 2017