Quick-Start Guide to the DBSP Data Reduction Pipeline
Table of contents
2.0 Starting the DBSP_DRP Program 2
3.0 Running the DBSP_DRP program 3
6.0 Profile Graph Display – Creating Flux Profiles 7
7. Generating Spectra and the Spectrum Display Controls 9
List of Figures
Figure 1 DBSP_DRP main controls panel..................................................................................... 2
Figure 2 Guide to the layout of DBSP_DRP controls...................................................................... 3
Figure 3 FITS image display image manipulation controls.......................................................... 4
Figure 4 FITS image zoom controls and related information........................................................ 5
Figure 5 Gaussian peak fit controls panel.................................................................................... 5
Figure 6 Example screen layout showing the use of multiple Gaussian fit overlays........................ 7
Figure 7 Accessing spectrum and profile displays........................................................................ 8
Figure 8 Spatial profile chart and extraction limits.................................................................... 8
Figure 9 Example spectra for DBSP_RED and DBSP_BLUE produced by "dsx"................................. 9
Figure 10 Spectrum displays controls including spectrum, signal to noise and estimated background. 10
Figure 11 Warning displayed when the "dsx" program could not find a wavelength solution.... 11
Figure 12 Using the mouse to zoom in on a portion of the spectrum chart................................. 11
Figure 13 The chart right-mouse button menu, saving and printing the plot.............................. 12
1.0 Introduction
The DBSP data reduction pipeline is a quick-look tool designed to provide wavelength-calibrated spectra extracted from both the DBSP red and blue cameras. A program called “dsx” written by Tom Barlow in C++ performs the actual reduction of the FITS image files to produce wavelength-calibrated spectra. The “dbsp_drp” program is a Java front-end that allows the observer to execute the data reduction pipeline and display the results without needing to learn the command line syntax of “dsx”. The “dbsp_drp” also allows an observer to use the mouse to determine the spatial segment of the spectra to extract for wavelength calibration.
2.0 Starting the DBSP_DRP Program
The “dbsp_drp” program is started by typing “dbsp_drp” in any terminal window on the observer computers in the Palomar Observatory data room. Typing this command starts the Java GUI, which should appear as in figure 1 below.
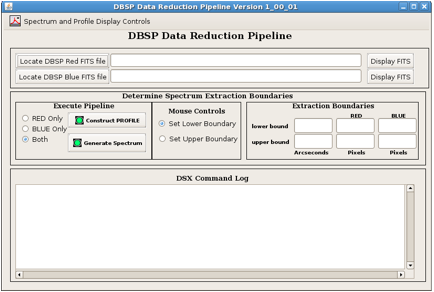
Figure 1 DBSP_DRP main controls panel
3.0 Running the DBSP_DRP program
The following sequence of steps is required to generate spectra for a given set of FITS images.
(1) Locate the DBSP Red and Blue FITS images (i.e. press “Locate DBSP Red/Blue FITS file” button and browse for the files)
(2) Construct Profiles (i.e. press “Construct PROFILE” button)
(3) Set lower and upper extraction limits (i.e. using mouse controls select lower and upper boundaries and click on the profile to determine the positions)
(4) Generate Spectrum (i.e. press the “Generate Spectrum” button)
Note that all of the graph display panels can be made visible by checking the associate menu item in the “Spectrum and Profile Display Controls” menu.
4.0 The Main Panel
The main control panel can be broken into three segments: (1) location of the raw FITS image files, (2) DSX execution controls and extraction boundary specification tools and (3) log of the DSX program output. In general, the observer starts by specifying the raw FITS image files to use in the reduction (top panel). The DSX program is used to construct a flux profile (“Construct PROFILE” button) from the raw images. The controls in the “Determine Spectrum Extraction Boundaries” panel are used to set and verify the additional parameters needed for extracting the spectra (i.e. the upper and lower extraction boundaries). The DSX Command Log panel displays a log of the commands sent to the DSX program and the output received from it. Additional displays such as the profile plot and the spectrum displays are initially invisible but may be made visible by checking the associated box in the “Spectrum and Profile Display Controls” Menu.
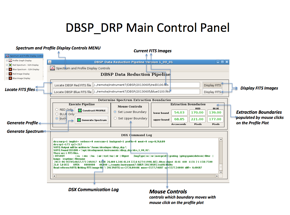
Figure 2 Guide to the layout of DBSP_DRP controls
5.0 FITS Image Display
When an FITS image is selected with the “Locate DBSP Red/Blue FITS File” buttons the FITS image is automatically loaded into the associated FITS image display control. The FITS image display controls may be made visible by depressing the “Display FITS” button or by checking the “Red/Blue Image Display” menu item on the “Spectrum and Profile Display Controls” menu. Each FITS image display control contains both an “Image Controls” and “Tools” menu.
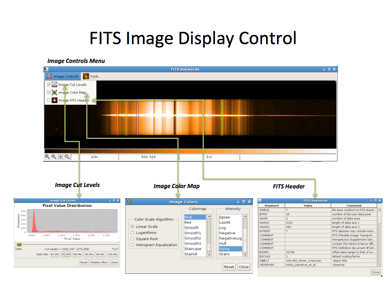
Figure 3 FITS image display image manipulation controls
Under the “Image Controls” menu are two controls that allow modification of the images appearance: (1) Image Cut Levels and (2) Image Color Map. The “Image Cut Levels” control displays a histogram of the image and allows observers to control which portions of the histogram are displayed in the image. The “Image Color Map” allow observers to control the color map and the color scale algorithm (e.g. linear, logarithmic, etc.) of the image.
The color bar at the base of the image can be used to control the contrast and brightness. Placing the mouse over the color bar at the base of the image and depressing either the left or the right mouse button controls the contrast and brightness of the image. Control the brightness of the image by holding down the left mouse button and moving the mouse left and right. Control the contrast by depressing the right mouse button and moving the mouse left and right along the color bar.
![]()
Figure 4 FITS image zoom controls and related information
The zoom level is controlled by the plus and minus magnifying glasses in
the left corner of the display. The third button next to the magnifying
glasses automatically scales the image to fit within the current window size
while the fourth button automatically sets the magnification back to 1X. The current magnification level is
displayed in the first box to the right of the zoom level controls (e.g. 1/3X
the default). As the mouse moves
over the image, the X/Y pixel position in the image is displayed in the second
box (e.g. 1108,56) while the third box displays the value of the pixel under
the mouse (e.g. 1075.0).
In the upper
right hand corner of the image display are two overlays. The upper overlay is the “pan” window,
which contains a yellow rectangle showing the area of the total image that is
displayed within the current window (only when the window contains only a
portion of the total image). The
lower overlay is a zoom window that displays a zoomed in version of the image
directly under the current mouse location.
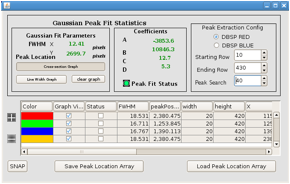
Figure 5 Gaussian peak fit controls panel
Under the “Tools” menu is the “Gaussian Profile Fit Tool”. The “Gaussian Profile Fit Tool” allows the observer to fit a Gaussian profile to an emission line (e.g. sky emission lines) and determine the line width and exact peak location. This tool is particularly useful when focusing the instrument. The mouse is used to determine the location along the slit (i.e. along the wavelength axis) where you wish to fit a Gaussian to an emission line. On the top, right hand side of the control is the “Peak Extraction Configuration” panel. This panel contains the controls for determining what portion of the FITS image is used in the Gaussian fit. The orientation of the FITS image is different for the red and blue FITS image files. DBSP red images are constructed with the wavelength dimension along the horizontal axis and the spatial dimension along the vertical axis. For DBSP blue images this is reversed with the wavelength dimension along the vertical axis and the horizontal axis corresponding to the spatial dimension. For this reason it is necessary to specify which type of FITS image is displayed in the window by selecting the red or blue radio button. DBSP FITS images can have different dimensions based upon the selected binning and the sub-array configuration used when taking the data. As a result, it’s necessary to specify the height and width (i.e. the beginning row/column and ending row/column) of the FITS image using the spinner controls in the “Peak Extraction Configuration” panel. The “Peak Search” spinner control determines the width of the section of the FITS image used in calculating the Gaussian fit. Whenever the mouse is clicked on the image display it will construct an overlay that starts at the starting row and ends at the ending row and is the peak search value wide centered about the mouse position.
Once the mouse has specified the position of the Gaussian fit overlay, the system extracts the corresponding section of the FITS image and sums it along the spatial dimension. If an emission line is present within the box overlay the system calculates a Gaussian fit to the data and displays the FWHM (Full Width at Half Maximum in pixels) and the peak location (in pixels) within the “Gaussian Fit Parameters” panel on the upper left side of the display. The coefficients (A, B, C and D) of the Gaussian fit are displayed in the “Coefficients” panel and the “Peak Fit Status” indicator is set to green. If a Gaussian fits could not be calculated the “Peak Fit Status” indicator is set to red in color and the coefficients, FWHM and peak location are all set to zero. A cross-section of the peak profile may be viewed by pressing the “Cross-section Graph” button in the “Gaussian Fit Parameters” panel. The cross-section graph displays the raw data in blue and the calculated Gaussian in red allowing the observer to judge whether the fit is accurate.
More than a single peak fit overlay may be created using the Gaussian peak-fitting tool. If the observer wishes to monitor the line width and position of multiple peaks in the spectrum they can add an unlimited number of overlay boxes to the display. The lower half of the panel contains a table that contains all relevant information on multiple Gaussian fit boxes. Multiple Gaussian fit boxes are created by selecting the (+) plus control to the left of the table. When the (+) plus button is selected it turns green in color and each click of the mouse on the image will create a new Gaussian fit overlay on the image whose characteristics (i.e. FWHM, peak position, etc.) are added as a row in the table. Once all of the emission lines of interest have been tagged with an overlay box the mouse is returned to normal operation by pressing the (+) button a second time turning it grey in color. Gaussian fit overlays may be removed by selecting the appropriate row in the table and then clicking the (-) minus button. Note that the minus button only turns green in color if a row of the table has been highlighted.
The array of Gaussian fit overlays is persistent and will be recalculated each time a new image is loaded into the image display window. In this fashion the observer can monitor the change in line width as a function of changing focus across the entire array. The observer may save the current position of the array of Gaussian fit boxes by pressing the “Save Peak Location Array” button. The file containing the position of all the Gaussian fit overlays is automatically created in the /rdata/TEMP directory and time stamped with the current date and time (e.g. GAUSSIAN_20130607_19_6.txt). The array of Gaussian fit overlays may be reloaded at any time by pressing the “Load Peak Location Array” button. Pressing this button will open a browse dialog box that can be used to locate the file containing the overlay descriptions.
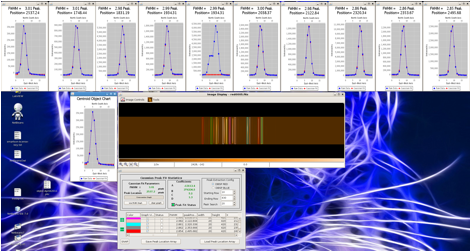
Figure 6 Example screen layout showing the use of multiple Gaussian fit overlays
6.0 Profile Graph Display – Creating Flux Profiles
The first step in creating an extracted spectrum from a FITS image file is to construct a spatial flux profile that will allow you to determine the extraction limits for the astronomical object. Construct a spatial profile of the spectra by pressing the “Construct PROFILE” button in the “Execute Pipeline” controls section of the GUI. If the “Both” radio button is selected the “Construct PROFILE” button will execute the “dsx” profile generation mechanism on both the red and blue images and overlay them on the same plot. If you wish to construct the profile for only one of the FITS images then select the “RED Only” or “BLUE Only” radio buttons in the left central portion of the GUI. The actual command sent to the “dsx” program appears in blue in the “DSX Command Log” text display. The output of the program appears in green in the same “DSX Command Log” text display.
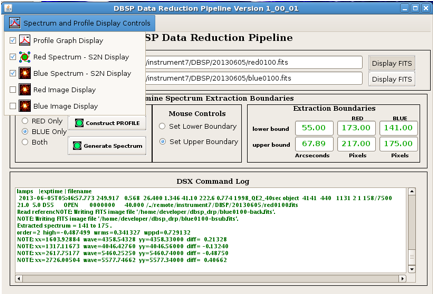
Figure 7 Accessing spectrum and profile displays
To examine the profile produced by “dsx”, make the profile chart visible by selecting the “Profile Graph Display” check box on the drop down menu in the upper left corner of the display.
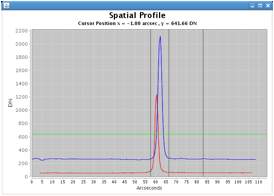
Figure 8 Spatial profile chart and extraction limits
Use the “Mouse Controls” radio button to select which boundary you wish to set (i.e. lower or upper boundary). Using the mouse, click on the profile to set the corresponding extraction boundary. The corresponding boundary position should appear in the “Extraction Boundaries” panel showing the boundary position is arc-seconds along the slit and in pixels for each of the spectra (i.e. RED and BLUE). Setting the lower and upper boundaries of the section to extract using the spatial profile determines the necessary “dsx” parameters. Note that the section extracted in pixels will be different for each of the FITS file depending upon their type (i.e. RED or BLUE spectra). The “dsx” program attempts to register the red and blue profiles in arc-seconds along the slit but the registration is not always perfect. If the observer wishes different extraction limits for the red and blue spectra then they should generate spectra for each individually, setting new extraction boundaries for each spectra (i.e. using the radio button in the “Execute Pipeline” panel).
7. Generating Spectra and the Spectrum Display Controls
After the extraction limits have been determined, pressing the “Generate Spectrum” button creates the spectra files and displays them. Typically the spectra are generated in a couple of seconds and the indicator icon on the “Generate Spectrum” button turns red while the “dsx” program is running.
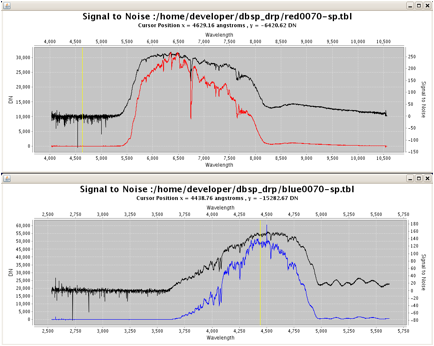
Figure 9 Example spectra for DBSP_RED and DBSP_BLUE produced by "dsx".
The “dsx” program extracts the spectra for each file and calculates the background and the signal to noise. Given the vast difference in the range axis limits for the spectra (in DN), background and signal to noise, it’s difficult to display all of the available information on a single plot. The extracted spectra for a given FITS image are displayed on two separate plot (1) signal to noise + spectrum and (2) background + spectrum. The signal to noise display depicts the spectrum as a DN vs. wavelength plot along with a signal to noise vs. wavelength over-plot using an independent range axis. Similarly, the background display overlays a background (in DN) vs. wavelength plot over a DN vs. wavelength plot of the extracted spectra. The background plot is also displayed on the signal to noise plot (as a green trace) but on the same scale as the spectrum making it difficult to examine the details of the background. The signal to noise and background plots (on their respective displays) are depicted in black while the spectrum are colored red or blue depending upon the instrument used to collect the FITS image.
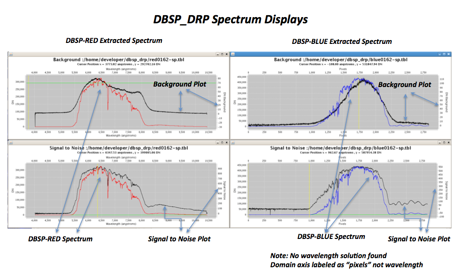
Figure 10 Spectrum displays controls including spectrum, signal to noise and estimated background.
Wavelength calibration is obviously one of the major goals of the extraction process but in some cases no wavelength solution can be found. When the wavelength calibration fails the domain axis label is changed to “pixels” and the extracted spectrum is plotted relative to pixels rather than wavelength. A warning that no wavelength solution was found is also displayed to the observer in the “DSX Command Log”.

Figure 11 Warning displayed when the "dsx" program could not find a wavelength solution
Each of the spectrum graph types (signal to noise and background) support a number of customization controls that can be accessed using the right mouse button. The pop-up menu accessed from the right mouse button allows the observer to zoom in or out by a fixed factor on each axis or to automatically auto range on each axis. The mouse can also be used to expand a given portion of the plot. For example, if the observer is interested in a zoomed in display of a set of absorption lines, this can be accomplished by pressing the left mouse button and dragging down and to the right until the area to be plotted has been highlighted (appears as a light blue box over the area to be expanded). When the left mouse button has been released, the plot will be redrawn setting the limits of the new plot to the area of the highlighted rectangle. The plot limits may be reset to default by either using the right mouse menu to auto-range both axes or by using the mouse. To redraw using default limits with the mouse you simply click the mouse and move up and to the left before releasing the left mouse button.

Figure 12 Using the mouse to zoom in on a portion of the spectrum chart
The right mouse button pop-menu also allows the user to save the current spectrum as a PNG file or the print the spectrum on a printer (if a printer is available). By default, the resulting *.png files will show up in the directory the user is in when the program is started (usually /home/user1). It is also worth mentioning that all of the charts may be resized by selecting the lower right hand corner with the mouse and changing the size of the window.
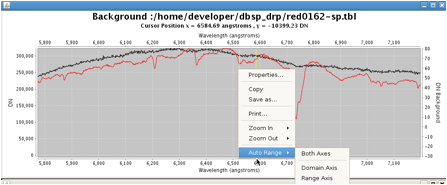
Figure 13 The chart right-mouse button menu, saving and printing the plot.
8.0 Conclusion
The “dbsp_drp” and “dsx” programs have been designed to provide rapid feedback to observers using DBSP at the Palomar observatory. The primary goal during development was to provide rapid extraction of wavelength-calibrated spectra along with performance metrics such as signal to noise ratio and background estimation. Observers using the program are encouraged to provide feedback, report bugs, and file requests for additional features.