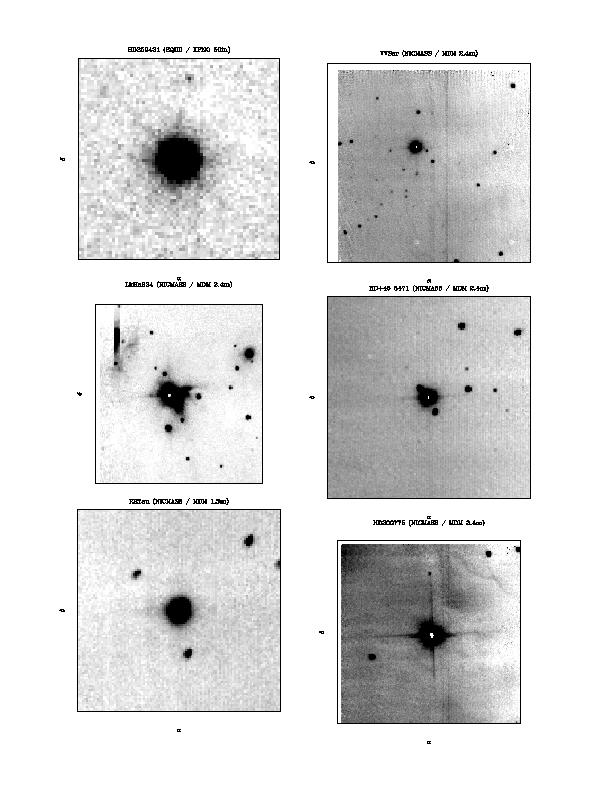
I have also worked to understand issues related to the distributions of stellar masses and ages in very young, isolated star forming regions. In particular, I am interested in regions containing massive pre-main sequence stars (Herbig Ae/Be stars). Optical and near-infrared imaging in the immediate vicinity of these high mass stars has in many cases revealed small aggregates of partially embedded lower mass stars, clustered around the central high mass star. These newly indentified clusters are characteristically made up of 5-50 stars covering spatial scales of just a few tenths of a parsec. The densest stellar condensations are seen in proximity to the most massive Herbig Ae/Be stars. In fact, the stellar density and the mass of the most massive star are directly correlated ( .ps version). It appears that these stars are rarely found in true isolation. Combined with what is known about the environments in which slightly older OBA stars are found, this evidence suggests the possibility that high mass stars may be formed *only* in locally clustered regions, and that in fact the presence of a cluster may be a dynamically necessary condition in the protostellar stage for the production of a high mass star. Our goals are to determine: 1) whether the massive Herbig Ae/Be stars are older than or younger than the lower mass stars comprising the surrounding clusters; 2) the stellar mass spectrum in these isolated star forming regions, and how it differs from the space- and time-averaged "initial" mass functions typically derived in larger, more complex young stellar clusters; and 3) the time sequence of star formation as a function of stellar mass (if such a sequence exists) in isolated star-forming environments.
The image above shows the the BD+40 4124 region. The upper panel is an R-band image (obtained with the CCD at the KPNO 0.9m) and the lower panel is a K-band image (obtained with the NICMASS camera at the MDM 2.4m). To the right are CO contours (obtained with the FCRAO 14m) in overlay on the optical image. The molecular emission peaks at or near the double source labeled in the infrared image as LkHa 225 = V1318 Cyg and extends northward in what might be described as a cometary tail.
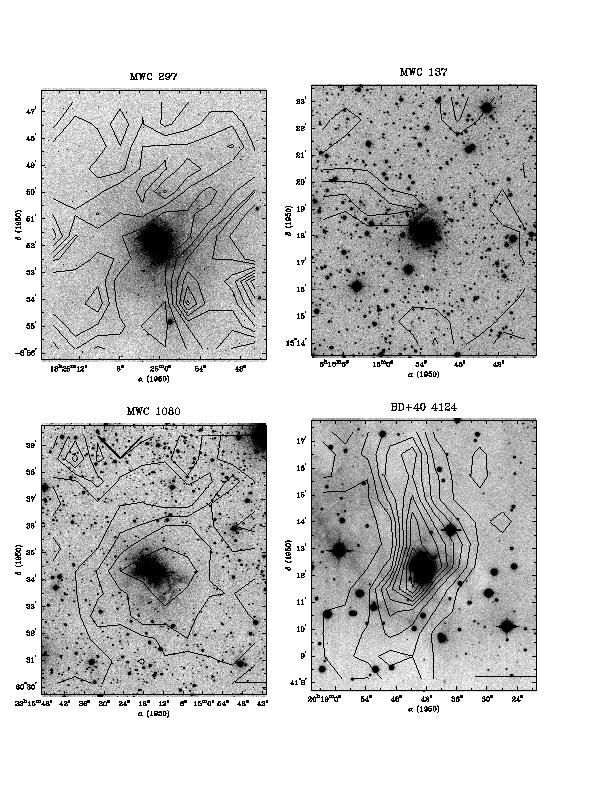
Here are some images showing the molecular environments of Ae/Be stars (taken from my PhD thesis work). The contours represent column density while the images are I-band CCD's. The size of each image is 8.4 x 10.1 arcmin^2
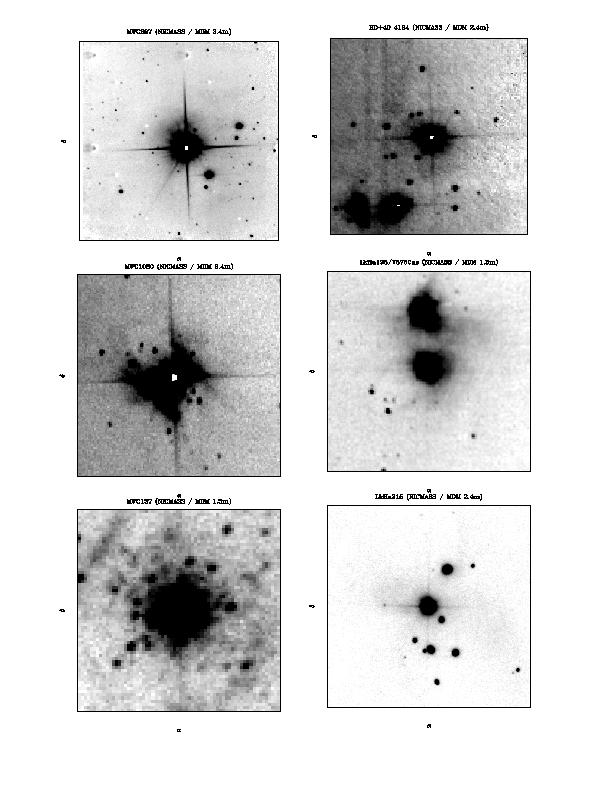
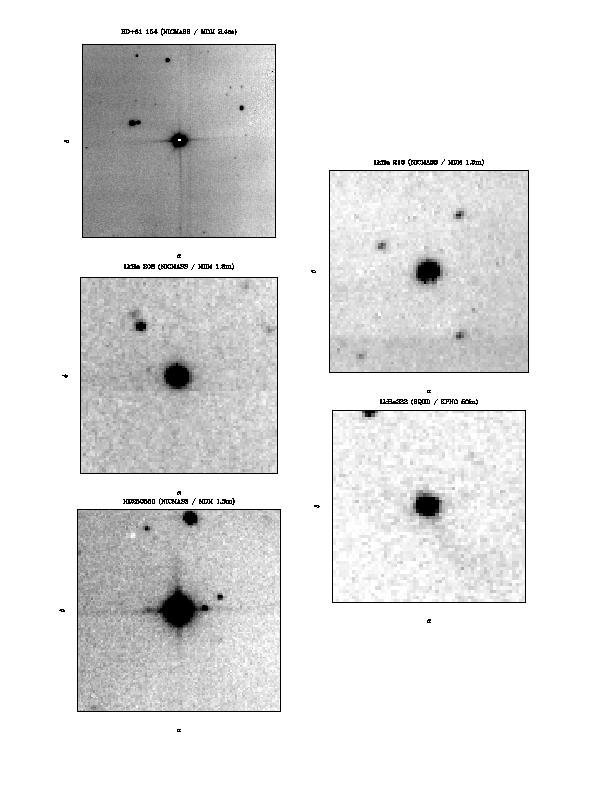
Here are some K-band images of Ae/Be stars (also taken from my PhD thesis work). The size of each image is 1/3 x 1/3 pc^2.
Any of the above (as well as images at VRI/JHK wavelengths and 12CO, 13CO, C18O, and CS molecules) are available as individual postscript files upon request. I also have spectra for all stars brighter than about 18'th magnitude within a few arcmin of each of these Ae/Be fields.
See my publications page for some Ae/Be-related papers.
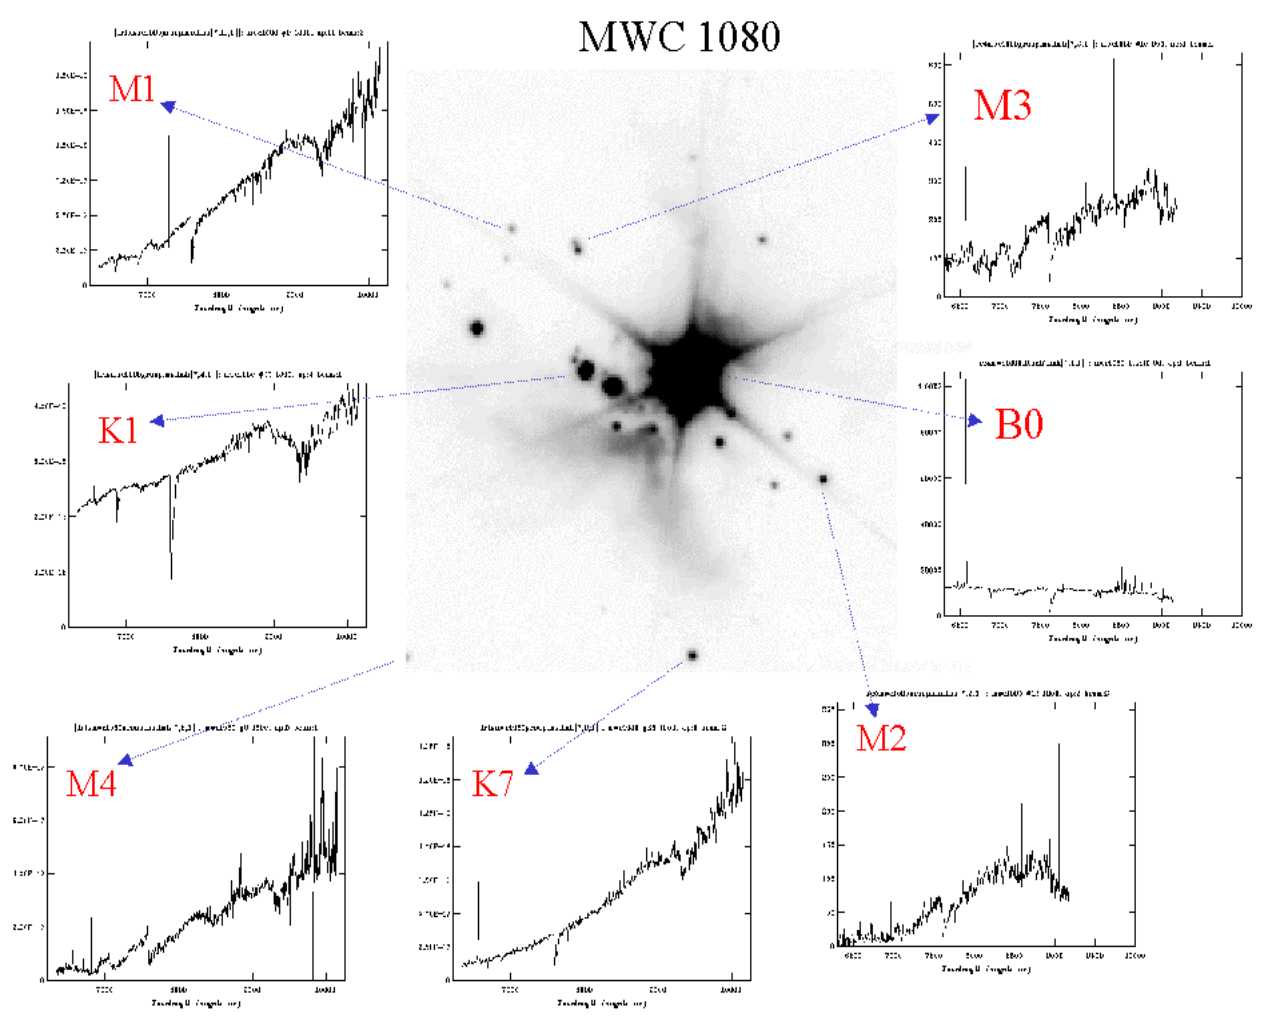
Added bonus for scrolling down this far -- Keck infrared image and optical spectroscopy of the MWC1080 region: